Upper Missouri River Basin Soil Moisture and Snowpack Dashboard
NOAA’s National Integrated Drought Information System (NIDIS) and National Centers for Environmental Information (NCEI), Montana Mesonet, Nebraska Mesonet, Mesonet at South Dakota State University, North Dakota Agricultural Weather Network (NDAWN), Wyoming Mesonet, U.S. Army Corps of Engineers
Note: The content and functionality of this dashboard are for demonstration purposes only and are not finalized, including some simulated data. Please read all map descriptions carefully.
Under Congressional direction, NOAA's National Integrated Drought Information System (NIDIS) is leading the Upper Missouri River Basin Data Value Study, an interagency study of the value of the data from the Upper Missouri River Basin Soil Moisture and Plains Snow Monitoring Build-Out to support improvements to water resource models, drought monitoring capabilities, and other applications. One goal of this study is to produce publicly-available, basin-wide soil moisture and snowpack data and maps on Drought.gov to support the U.S. Drought Monitor authors and contributors.
To facilitate access to the diverse datasets necessary to fully monitor basin-wide hydrological conditions, the U.S. Drought Portal team created an interactive dashboard. The Drought Portal team ingests station-based soil moisture and snowpack data from the five state mesonets in the Upper Missouri River Basin (UMRB)—Montana, Nebraska, North Dakota, South Dakota, and Wyoming. Data are ingested via Synoptic, who is contracted by the National Weather Service’s National Mesonet Program to develop the UMRB data access platform. Soil moisture and snowpack data are valid through 12z each Tuesday, and are displayed in actionable maps. Overlays, such as the U.S. Drought Monitor or snow water equivalent (SWE), are also available to provide additional context to station-level observations that inform drought monitoring and decision-making in the region.
Available maps include:
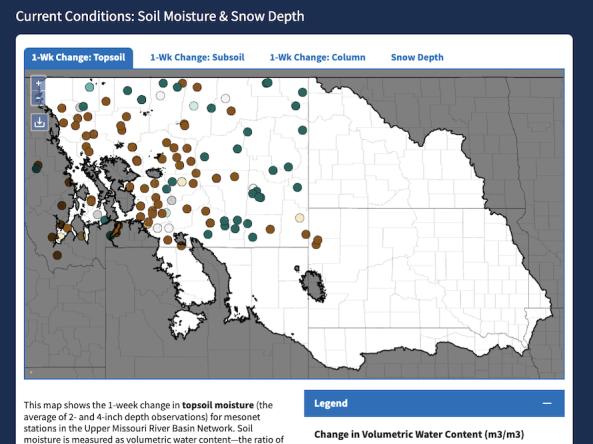
- Soil moisture (volumetric water content) change maps for 1, 4, 8, and 12 weeks, which can show important trends in evolving conditions
- Topsoil: Average of 2- and 4-inch depth observations
- Subsoil: Average of 8- and 20-inch depth observations
- Total Column: Average of 2-, 4-, 8-, and 20-inch depth observations
- Snow depth current conditions (inches).
Additional maps, such as fractional available water (FAW), snow water equivalent (SWE), and categorical soil moisture, are planned for future phases of development. Because of the current short period of record for this new network, VWC anomalies or percentiles are not yet available.
For additional soil moisture and snowpack data and information, visit the five UMRB state mesonets, or view time series graphs of the data on the U.S. Army Corps of Engineers UMRB Monitoring Network page.
Access
UMRB Soil Moisture & Snowpack Dashboard
UMRB Monitoring Network Data: View and download time series graphs of soil moisture and snow data, as well as photos of the mesonet stations.
View soil moisture and snowpack data from the UMRB state mesonets:
Documentation
Key Project Documents
USACE Upper Missouri River Basin Soil Moisture and Plains Snow Monitoring Build-Out
Current Status of the Build-Out
Upper Missouri River Basin Soil Moisture and Plains Snow Data Value Study
Methodology: Soil Moisture Change Maps
Weekly changes in soil moisture conditions provide one of the most straightforward measures of evolving or trending hydrological conditions. To represent a variety of short- to long-term conditions, weekly changes in volumetric water content (VWC) are represented in units of m3m-3 for topsoil (2-inch and 4-inch depth observations), subsoil (8-inch and 20-inch depth observations), and column (2-, 4-, 8-, and 20-inch depth observations). Differences are computed as the most recent Tuesday at 12:00 UTC minus Tuesday at 12:00 UTC X weeks ago.
Computing Change Maps with Frozen Soils*
Since the soil sensors are unable to detect ice in the soil, soil moisture observations are set to missing when soil temperatures dip below 2 °C. This threshold was chosen after conversations with experts and analysis of soil moisture time series (forthcoming) over the winter season to reflect the lowest temperature where we are confident there is little to no ice present. The higher threshold allows us to avoid false freeze and thaw events when soil temperatures may bounce around the 0 °C threshold during either winter freeze and spring thaw periods.
Since frozen water in the soil is unlikely to change over the winter/frozen season, evaluations of soil moisture change at stations since the latest unfrozen period are feasible and may have useful monitoring applications, which is being explored as an experimental product. To account for frozen soils, soil moisture changes at stations are not computed for the current Tuesday if soil temperatures are below 2 °C. If soil temperatures at a given station are currently above 2 °C, but a previous Tuesday X weeks ago is 2 °C or less, the soil moisture change map will show the difference between the current Tuesday at 12:00 UTC and the most recent unfrozen (>2 °C) Tuesday at 12:00 UTC for that station. For example, for the 4-week soil moisture change map, if the Tuesday at 12:00 UTC 4 weeks ago is below 2 °C, the change map entry for the station will use the most recent unfrozen Tuesday that is older than 4 weeks.
* Note: This methodology has not yet been applied to the soil moisture change maps, as of May 15, 2024.