U.S. flag

An official website of the United States government

DATA & MAPS

Select categories to browse data

Looking to Download Data? The Drought.gov team reformats data from multiple partners into web- and GIS-ready formats, which we use throughout Drought.gov. These data are free for all to download.
Search Results(22)

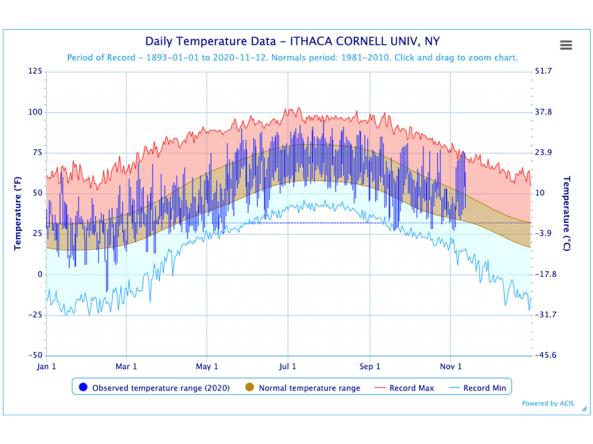
The Regional Climate Centers (RCC) Applied Climate Information System (ACIS) offers interactive temperature and precipitation charts with single- or multi-station capabilities.

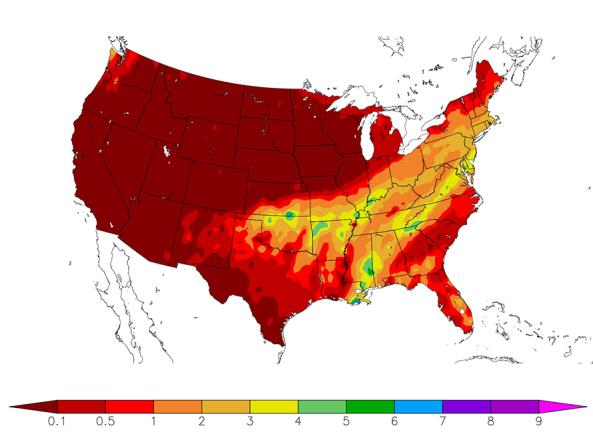
HPRCC produces daily climate maps using data from the Applied Climate Information System (ACIS). The maps and data can be accessed and downloaded from the HPRCC website.


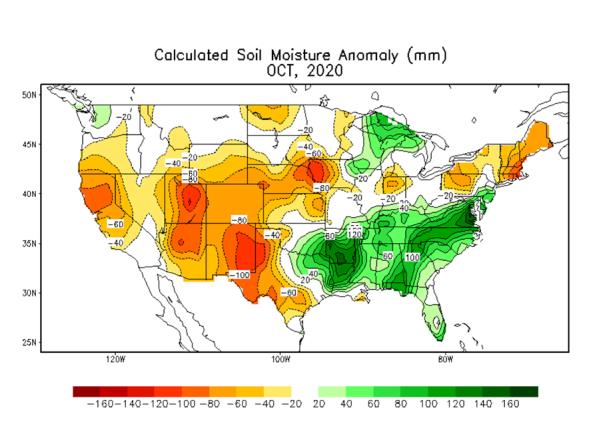
Soil moisture conditions at the daily and monthly scales depicting total soil moisture, percentiles and anomalies, as well as monthly and seasonal change.

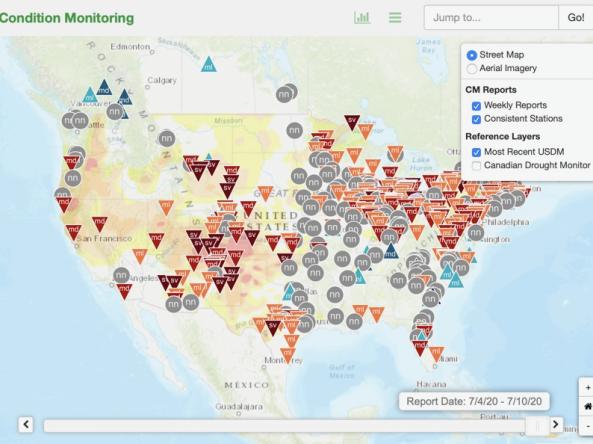
This condition monitoring map is a tool intended to depict local, community-level conditions and how recent weather and climate events have affected those communities.