North-American Land Data Assimilation System (NLDAS)
National Oceanic and Atmospheric Administration (NOAA) National Centers for Environmental Prediction (NCEP) Environmental Modeling Center (EMC)
The goal of the North American Land Data Assimilation System (NLDAS) is to construct quality-controlled, and spatially and temporally consistent, land-surface model (LSM) datasets from the best available observations and reanalyses to support modeling activities. Specifically, this system is intended to reduce the errors in the stores of soil moisture and energy which are often present in numerical weather prediction models, and which degrade the accuracy of forecasts.
NLDAS is currently running operationally in near real-time (~4 day lag) on a 1/8th-degree grid with an hourly timestep over central North America (25-53 North). Retrospective hourly/monthly NLDAS datasets extend back to January 1979. NLDAS constructed a forcing dataset from a daily gauge-based precipitation analysis (temporally disaggregated to hourly using Stage II radar data), bias-corrected shortwave radiation, and surface meteorology reanalyses to drive four different LSMs to produce outputs of surface fluxes, soil moisture, snow cover, streamflow, etc.
NLDAS is a collaboration project among several groups: NOAA/NCEP's Environmental Modeling Center (EMC), NASA/GSFC's Hydrological Sciences Laboratory, Princeton University, the University of Washington, the NOAA/NWS Office of Hydrological Development (OHD), and the NOAA/NCEP Climate Prediction Center (CPC). NLDAS is a core project with support from the NOAA Climate Program Office's Modeling, Analysis, Predictions, and Projections (MAPP) program. Data from the project can be accessed from the NASA Goddard Earth Science Data and Information Services Center (GES DISC) as well as from the NCEP/EMC NLDAS website and the Climate Engine tool.
Drought Applications
NOAA's Climate Prediction Center (CPC) derives the NLDAS experimental drought monitor from near real-time soil moisture output from both the NASA MOSAIC and NCEP Noah land surface models. The anomalies and percentiles are based on a 28 year climatology (1980 - 2007). Two separate climatology files are used; one for the calculation of anomalies, and one for the calculation of percentiles. The anomaly climatology file contains 1 soil moisture value per day (daily average over 28 years) for each gridbox. The percentile climatology file contains 140 soil moisture values per day (5 for each year) for each gridbox.
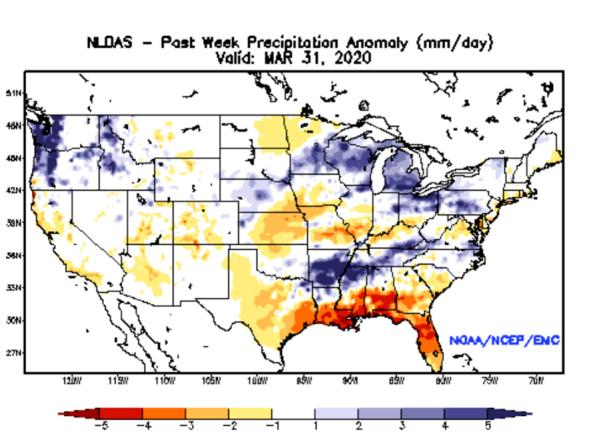
Anomalies are calculated by comparing the current soil moisture values to mean values for the same time of year over each gridbox. For weekly anomalies, the past week's worth of soil moisture values are first averaged together to form a single value. The same procedure is applied to the corresponding week of the anomaly climatology file. The two values are then differenced to derive an anomaly soil moisture value. A similar procedure is followed to compute monthly (30 day) anomalies.
Percentiles are based upon an 5 day moving window of soil moisture values. This acts to smooth out the soil moisture record. Weekly analyses for each gridbox are computed by comparing the past 7 days to corresponding period in the percentile climatology. Taking day 1 of the week as an example, hourly soil moisture values from this day are averaged together to form a single value. This value is then ranked against the soil moisture values from each day of the 5 day window surrounding day 1 of the corresponding week in the percentile climatology. This same process is then repeated for days 2-7 of the week, with each day of the week contributing equally to the overall ranking value. Monthly (30 day) percentile analyses are computed in a similar fashion.
How to
What can I do with these data?
- View current or past weekly and monthly soil moisture anomalies.
How do I use the site?
- Use drop-down menu to select a map “type”
- To save image, right-click the map and select “Save Image As...” in GIF format
Access
NLDAS - Home page for program information: Hosted by NASA, this web site provides an overview of the NLDAS program and products.
NLDAS on Climate Engine: The Climate Engine tool includes access and visualization of the NLDAS data, along with GLDAS and FLDAS data.
The NLDAS-based Drought Monitoring products are produced at NOAA's Climate Prediction Center, and include:
NLDAS Soil Moisture maps: Soil Moisture page for the North-American Land Data Assimilation System (NLDAS) Monitor.
NLDAS Standardized Runoff maps: Standardized Runoff page for the NLDAS Monitor.
NLDAS Integrated Drought Index maps: Integrated Drought Index page for the NLDAS Monitor.