Climate Toolbox: Seasonal Forecast Graphs
University of California, Merced
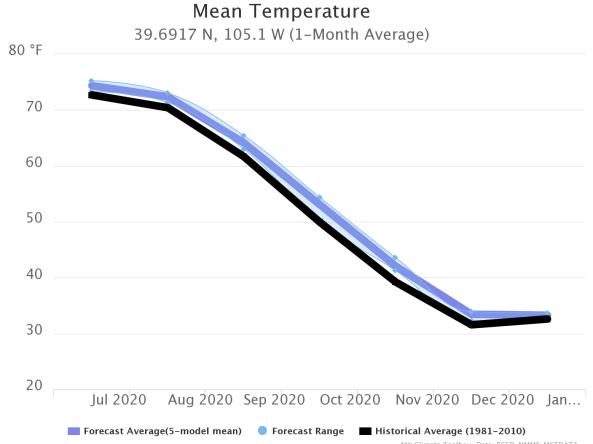
This tool, available as part of The Climate Toolbox, provides a graphical summary of seasonal climate forecasts of temperature and precipitation for the next one to seven months for a selected location within the contiguous United States.
The graphs give a view of the average forecast (as well as the spread) for temperature and precipitation using the best available science from downscaled gridded seasonal forecast climate model data from the North American Multi-Model Ensemble (NMME) project.
Documentation
Seasonal climate forecasts for the next seven months downscaled from 7 models of the North American Multi-Model Ensemble (NMME) to a ~4-km spatial grain across the contiguous United States for compatibility with the gridMET data. This dataset is updated by the third week of each month with forecasts initialized on the 9th of each month for the next 7 months of data.
For more information, visit the Climate Toolbox Seasonal Forecasts web page and click "Documentation" in the top right corner.