International
Drought is a natural hazard with far-reaching impacts that range from economic losses to loss of agriculture and livelihood. Drought can cause or exacerbate water, food, and national security hazards. The maps, tools, and resources on this page address drought conditions around the world.
Drought results from an imbalance between water supply and water demand. The Standardized Precipitation Index captures how observed precipitation (rain, hail, snow) deviates from the climatological average over a given time period.
This map shows a 3-month SPI from the European Centre for Medium-Range Weather Forecasts (ECWMF) Reanalysis Version 5 (ERA5).
The ERA5 daily precipitation dataset from 1940–present combines vast amounts of historical observations into global estimates using advanced modeling and data assimilation systems. ERA5 is produced by the Copernicus Climate Change Service (C3S) at ECMWF.
Drought results from an imbalance between water supply and water demand. The Standardized Precipitation Index captures how observed precipitation (rain, hail, snow) deviates from the climatological average over a given time period.
This map shows a 9-month SPI from the Global Precipitation Climatology Centre (GPCC).
The GPCC monthly precipitation dataset from 1901–present is calculated from global station data.
The Vegetation Health Index is a proxy characterizing vegetation health or a combined estimation of moisture and thermal conditions. Vegetation health is often used to estimate crop condition and anticipated yield. Values below 40 (pink/orange shades) indicate different levels of vegetation stress, and losses of crop and pasture production might be expected. Values above 60 (green/blue shades) indicate favorable conditions.
The GRACE-Based Surface Soil Moisture Drought Indicator describes the current wet or dry conditions of the top 2 cm of soil, expressed as a percentile showing the probability of occurrence within the period of record from 1948–2012. This product is based on terrestrial water storage observations derived from NASA GRACE satellite data and integrated with other observations, using a sophisticated numerical model of land surface water and energy processes.
Red and orange hues indicate drier soil moisture conditions, while blue hues indicate wetter conditions.
A drought index combines multiple drought indicators (e.g., precipitation, temperature, soil moisture) to depict drought conditions. For some products, like the U.S. Drought Monitor, authors combine their analysis of drought indicators with input from local observers. Other drought indices, like the Standardized Precipitation Index (SPI), use an objective calculation to describe the severity, location, timing, and/or duration of drought.
Learn MoreDrought is defined as the lack of precipitation over an extended period of time, usually for a season or more, that results in a water shortage. Changes in precipitation can substantially disrupt crops and livestock, influence the frequency and intensity of severe weather events, and affect the quality and quantity of water available for municipal and industrial use.
Learn MoreA drought index combines multiple drought indicators (e.g., precipitation, temperature, soil moisture) to depict drought conditions. For some products, like the U.S. Drought Monitor, authors combine their analysis of drought indicators with input from local observers. Other drought indices, like the Standardized Precipitation Index (SPI), use an objective calculation to describe the severity, location, timing, and/or duration of drought.
Learn MoreFlash drought is the rapid onset or intensification of drought. Unlike slow-evolving drought, which is caused by a decline in precipitation, flash drought occurs when low precipitation is accompanied by abnormally high temperatures, high winds, and/or changes in radiation. These sometimes-rapid changes can quickly raise evapotranspiration rates and remove available water from the landscape.
Learn MoreDrought can reduce the water availability and water quality necessary for productive farms, ranches, and grazing lands, resulting in significant negative direct and indirect economic impacts to the agricultural sector. Monitoring agricultural drought typically focuses on examining levels of precipitation, evaporative demand, soil moisture, and surface/groundwater quantity and quality.
Learn MoreDrought can result in reduced growth rates, increased stress on vegetation, and alterations or transformations to the plant community and/or the entire ecosystem. During periods of drought, plants increase their demand for water through increased evapotranspiration and longer growing seasons.
Learn MoreSoil moisture plays an important role in drought and flood forecasting, agricultural monitoring, forest fire prediction, water supply management, and other natural resource activities. Soil moisture observations can forewarn of impending drought or flood conditions before other more standard indicators are triggered.
Learn MoreFlash drought is the rapid onset or intensification of drought. Unlike slow-evolving drought, which is caused by a decline in precipitation, flash drought occurs when low precipitation is accompanied by abnormally high temperatures, high winds, and/or changes in radiation. These sometimes-rapid changes can quickly raise evapotranspiration rates and remove available water from the landscape.
Learn MoreDrought can reduce the water availability and water quality necessary for productive farms, ranches, and grazing lands, resulting in significant negative direct and indirect economic impacts to the agricultural sector. Monitoring agricultural drought typically focuses on examining levels of precipitation, evaporative demand, soil moisture, and surface/groundwater quantity and quality.
Learn MoreDrought can result in reduced growth rates, increased stress on vegetation, and alterations or transformations to the plant community and/or the entire ecosystem. During periods of drought, plants increase their demand for water through increased evapotranspiration and longer growing seasons.
Learn MoreDry Conditions
D4 - Exceptional Drought (SPI of -2.0 or less)
The Standardized Precipitation Index (SPI) value for this location is -2.0 or less. SPI values can be interpreted as the number of standard deviations by which the precipitation anomaly deviates from the long-term mean. An SPI of -2.0 or less indicates Exceptional Drought (D4) conditions.
D3 - Extreme Drought (SPI of -1.9 to -1.6)
The Standardized Precipitation Index (SPI) value for this location is between -1.9 to -1.6. SPI values can be interpreted as the number of standard deviations by which the precipitation anomaly deviates from the long-term mean. An SPI of -1.9 to -1.6 indicates Extreme Drought (D3) conditions.
D2 - Severe Drought (SPI of -1.5 to -1.3)
The Standardized Precipitation Index (SPI) value for this location is between -1.5 to -1.3. SPI values can be interpreted as the number of standard deviations by which the precipitation anomaly deviates from the long-term mean. An SPI of -1.5 to -1.3 indicates Severe Drought (D2) conditions.
D1 - Moderate Drought (-1.2 to -0.8)
The Standardized Precipitation Index (SPI) value for this location is between -1.2 to -0.8. SPI values can be interpreted as the number of standard deviations by which the precipitation anomaly deviates from the long-term mean. An SPI of -1.2 to -0.8 indicates Moderate Drought (D1) conditions.
D0 - Abnormally Dry (SPI of -0.7 to -0.5)
The Standardized Precipitation Index (SPI) value for this location is between -0.7 to -0.5. SPI values can be interpreted as the number of standard deviations by which the precipitation anomaly deviates from the long-term mean. An SPI of -0.7 to -0.5 indicates Abnormally Dry (D0) conditions.
Wet Conditions
W0 (0.5 to 0.7)
The Standardized Precipitation Index (SPI) value for this location is between 0.5 to 0.7, indicating abnormally wet (W0) conditions.
W1 (0.8 to 1.2)
The Standardized Precipitation Index (SPI) value for this location is between 0.8 to 1.2, indicating moderate wet (W1) conditions.
W2 (1.3 to 1.5)
The Standardized Precipitation Index (SPI) value for this location is between 1.3 to 1.5, indicating severe wet (W2) conditions.
W3 (1.6 to 1.9)
The Standardized Precipitation Index (SPI) value for this location is between 1.6 to 1.9, indicating extreme wet (W3) conditions.
W4 (2.0 or more)
The Standardized Precipitation Index (SPI) value for this location is 2.0 or greater, indicating exceptional wet (W4) conditions.
Dry Conditions
D4 (-2.0 or less)
The Standardized Precipitation Index (SPI) value for this location is -2.0 or less, indicating exceptional drought (D4) conditions.
D3 (-1.9 to -1.6)
The Standardized Precipitation Index (SPI) value for this location is between -1.9 to -1.6, indicating extreme drought (D3) conditions.
D2 (-1.5 to -1.3)
The Standardized Precipitation Index (SPI) value for this location is between -1.5 to -1.3, indicating severe drought (D2) conditions.
D1 (-1.2 to -0.8)
The Standardized Precipitation Index (SPI) value for this location is between -1.2 to -0.8, indicating moderate drought (D1) conditions.
D0 (-0.7 to -0.5)
The Standardized Precipitation Index (SPI) value for this location is between -0.7 to -0.5, indicating abnormally dry (D0) conditions.
Neutral Conditions (-0.5 to 0.5)
The Standardized Precipitation Index (SPI) value for this location is between -0.5 to 0.5, indicating neutral conditions.
Wet Conditions
W0 (0.5 to 0.7)
The Standardized Precipitation Index (SPI) value for this location is between 0.5 to 0.7, indicating abnormally wet (W0) conditions.
W1 (0.8 to 1.2)
The Standardized Precipitation Index (SPI) value for this location is between 0.8 to 1.2, indicating moderate wet (W1) conditions.
W2 (1.3 to 1.5)
The Standardized Precipitation Index (SPI) value for this location is between 1.3 to 1.5, indicating severe wet (W2) conditions.
W3 (1.6 to 1.9)
The Standardized Precipitation Index (SPI) value for this location is between 1.6 to 1.9, indicating extreme wet (W3) conditions.
W4 (2.0 or more)
The Standardized Precipitation Index (SPI) value for this location is 2.0 or greater, indicating exceptional wet (W4) conditions.
Unfavorable Conditions
Favorable Conditions
Surface Soil Moisture: Wetness Percentile
Drought results from an imbalance between water supply and water demand. The Standardized Precipitation Index captures how observed precipitation (rain, hail, snow) deviates from the climatological average over a given time period.
This map shows a 3-month SPI from the European Centre for Medium-Range Weather Forecasts (ECWMF) Reanalysis Version 5 (ERA5).
The ERA5 daily precipitation dataset from 1940–present combines vast amounts of historical observations into global estimates using advanced modeling and data assimilation systems. ERA5 is produced by the Copernicus Climate Change Service (C3S) at ECMWF.
Drought results from an imbalance between water supply and water demand. The Standardized Precipitation Index captures how observed precipitation (rain, hail, snow) deviates from the climatological average over a given time period.
This map shows a 9-month SPI from the Global Precipitation Climatology Centre (GPCC).
The GPCC monthly precipitation dataset from 1901–present is calculated from global station data.
The Vegetation Health Index is a proxy characterizing vegetation health or a combined estimation of moisture and thermal conditions. Vegetation health is often used to estimate crop condition and anticipated yield. Values below 40 (pink/orange shades) indicate different levels of vegetation stress, and losses of crop and pasture production might be expected. Values above 60 (green/blue shades) indicate favorable conditions.
The GRACE-Based Surface Soil Moisture Drought Indicator describes the current wet or dry conditions of the top 2 cm of soil, expressed as a percentile showing the probability of occurrence within the period of record from 1948–2012. This product is based on terrestrial water storage observations derived from NASA GRACE satellite data and integrated with other observations, using a sophisticated numerical model of land surface water and energy processes.
Red and orange hues indicate drier soil moisture conditions, while blue hues indicate wetter conditions.
This map updates daily with data from Google Earth Engine's (ERA5-Land Daily Aggregated) dataset. The typical latency of the data is 7 to 10 days.
The GPCC 9-Month Standardized Precipitation Index is updated on the 10th of each month with data for the previous month.
The Vegetation Health Index map updates weekly.
Data from NASA GRACE are updated weekly on Mondays, and this Drought.gov map is updated every Tuesday.
A drought index combines multiple drought indicators (e.g., precipitation, temperature, soil moisture) to depict drought conditions. For some products, like the U.S. Drought Monitor, authors combine their analysis of drought indicators with input from local observers. Other drought indices, like the Standardized Precipitation Index (SPI), use an objective calculation to describe the severity, location, timing, and/or duration of drought.
Learn MoreDrought is defined as the lack of precipitation over an extended period of time, usually for a season or more, that results in a water shortage. Changes in precipitation can substantially disrupt crops and livestock, influence the frequency and intensity of severe weather events, and affect the quality and quantity of water available for municipal and industrial use.
Learn MoreA drought index combines multiple drought indicators (e.g., precipitation, temperature, soil moisture) to depict drought conditions. For some products, like the U.S. Drought Monitor, authors combine their analysis of drought indicators with input from local observers. Other drought indices, like the Standardized Precipitation Index (SPI), use an objective calculation to describe the severity, location, timing, and/or duration of drought.
Learn MoreDrought is defined as the lack of precipitation over an extended period of time, usually for a season or more, that results in a water shortage. Changes in precipitation can substantially disrupt crops and livestock, influence the frequency and intensity of severe weather events, and affect the quality and quantity of water available for municipal and industrial use.
Learn MoreA drought index combines multiple drought indicators (e.g., precipitation, temperature, soil moisture) to depict drought conditions. For some products, like the U.S. Drought Monitor, authors combine their analysis of drought indicators with input from local observers. Other drought indices, like the Standardized Precipitation Index (SPI), use an objective calculation to describe the severity, location, timing, and/or duration of drought.
Learn MoreFlash drought is the rapid onset or intensification of drought. Unlike slow-evolving drought, which is caused by a decline in precipitation, flash drought occurs when low precipitation is accompanied by abnormally high temperatures, high winds, and/or changes in radiation. These sometimes-rapid changes can quickly raise evapotranspiration rates and remove available water from the landscape.
Learn MoreDrought can reduce the water availability and water quality necessary for productive farms, ranches, and grazing lands, resulting in significant negative direct and indirect economic impacts to the agricultural sector. Monitoring agricultural drought typically focuses on examining levels of precipitation, evaporative demand, soil moisture, and surface/groundwater quantity and quality.
Learn MoreDrought can result in reduced growth rates, increased stress on vegetation, and alterations or transformations to the plant community and/or the entire ecosystem. During periods of drought, plants increase their demand for water through increased evapotranspiration and longer growing seasons.
Learn MoreSoil moisture plays an important role in drought and flood forecasting, agricultural monitoring, forest fire prediction, water supply management, and other natural resource activities. Soil moisture observations can forewarn of impending drought or flood conditions before other more standard indicators are triggered.
Learn MoreFlash drought is the rapid onset or intensification of drought. Unlike slow-evolving drought, which is caused by a decline in precipitation, flash drought occurs when low precipitation is accompanied by abnormally high temperatures, high winds, and/or changes in radiation. These sometimes-rapid changes can quickly raise evapotranspiration rates and remove available water from the landscape.
Learn MoreDrought can reduce the water availability and water quality necessary for productive farms, ranches, and grazing lands, resulting in significant negative direct and indirect economic impacts to the agricultural sector. Monitoring agricultural drought typically focuses on examining levels of precipitation, evaporative demand, soil moisture, and surface/groundwater quantity and quality.
Learn MoreDrought can result in reduced growth rates, increased stress on vegetation, and alterations or transformations to the plant community and/or the entire ecosystem. During periods of drought, plants increase their demand for water through increased evapotranspiration and longer growing seasons.
Learn MoreKey Impacts of Drought around the Globe
Environmental Impacts
Droughts can compromise a wide range of ecosystem services, including provisioning services such as food, fuel, and freshwater; regulating services such as pollination and pest regulation; and support services such as soil fertility and nutrient cycling. Significant or persistent droughts may alter ecosystem functions and compromise ecosystem goods and services, resulting in diminished or damaged ecological functioning.
Economic Impacts
Droughts may result in significant, long-term economic losses in a range of sectors. Losses may be local to the drought-affected area or they may be widespread through economic value chains and by cascading losses to other sectors and the national or global economy. In some regions of the world, drought may cause or exacerbate food shortages and food insecurity, unemployment, poverty, inflation, conflict, and internal displacement or migration.
Cultural and Social Impacts
Cultural and social constructs underlie how water is perceived, valued, and managed in different societies. In many cultures and belief systems, water is strongly tied to cultural heritage and religious and spiritual practices. These may inform a social understanding of the causes and solutions for drought and may support communities in coping with drought.
Health Impacts
Drought can cause significant human health impacts, and the socioeconomic environment in which drought occurs influences the resilience of affected populations. In poorer or marginalized communities, drought may exacerbate existing health disparities. Drought impacts on food production systems and agricultural value chains can contribute to nutritional deficiencies. Drought can also exacerbate gaps in sanitation and hygiene coverage and reliability.
Featured International Drought Maps
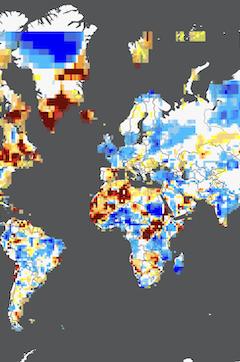
Global Drought Monitor
The Global Drought Information System (GDIS) is an international effort to pull together the best non-prescriptive drought information from local providers and provide an “apples to apples” comparison of drought conditions around the world. The Global Drought Monitor depicts current drought conditions across the globe using a “bottom-up” approach. This means that the drought conditions on each continent are assessed by the Nations of that continent.
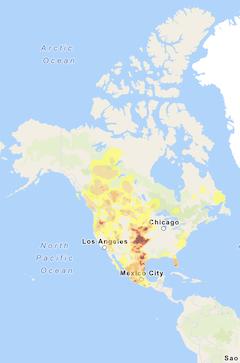
North American Drought Monitor
The North American Drought Monitor (NADM) is a cooperative effort between drought experts in Canada, Mexico, and the United States to monitor drought across the continent on an ongoing basis. The program was initiated at a three-day workshop in late April 2002 and is part of a larger effort to improve the monitoring of climate extremes on the continent. The NADM is updated monthly and is based on the U.S. Drought Monitor.
Tools to Visualize and Analyze Drought Worldwide
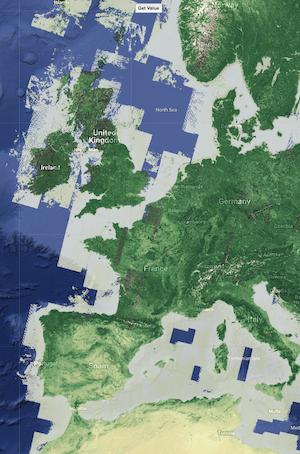
Climate Engine
Climate Engine uses Google’s Earth Engine to process satellite and climate data on demand to visualize value and anomaly mapping, as well as time series and statistical summaries of datasets. This allows users to analyze and interact with climate and earth observations for decision support related to drought, water use, agriculture, wildfire, and ecology.
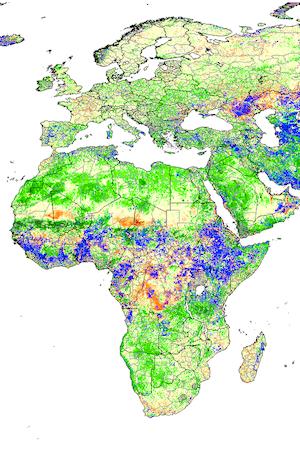
Global Information and Early Warning System on Food and Agriculture
The Global Information and Early Warning System on Food and Agriculture (GIEWS) seeks to strengthen agricultural drought monitoring and early warning globally. GIEWS uses remote sensing to estimate precipitation and to monitor the following, both globally and for individual countries: Agricultural Stress Index; drought intensity; Normalized Difference Vegetation Index (NDVI) anomalies; Vegetation Condition Index; and Vegetation Health Index. A country-level Agricultural Stress Index System (ASIS) tool has been incorporated into GIEWS to support country-level monitoring and management of agricultural drought, providing more precise information on drought stress to crops. The tool will be expanded to more countries in the future.
Global Drought Observatory
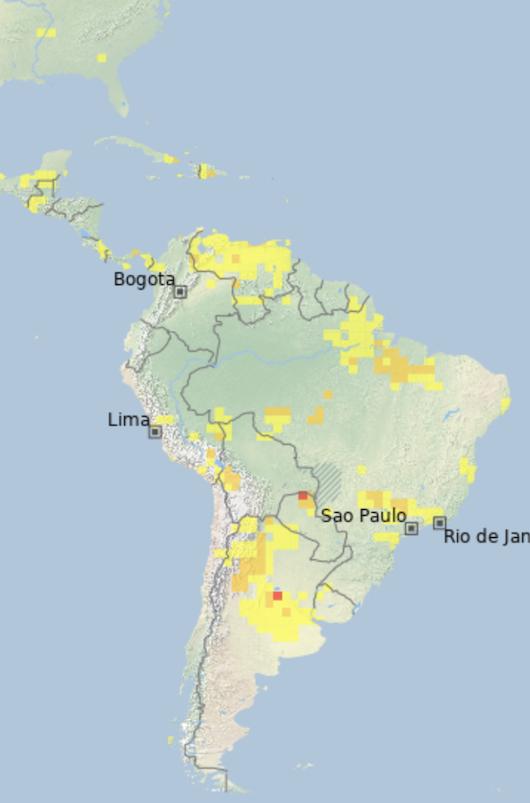
The MapViewer of the Global Drought Observatory (GDO), hosted by the European Commission, generates global maps of monthly precipitation, mean annual precipitation, SPI, soil moisture anomaly, and NASA Gravity Recovery and Climate Experiment (GRACE) Total Water Storage anomaly. The site also supports mapping of fire danger from the Global Wildfire Information System; information from the Global Disaster Alert and Coordination System (see below for more information); the Wetlands drought index from Ramsar; and an up-to-date “Risk of Drought Impact for Agriculture” by country. The GDO MapViewer supports comparison of monthly or 10-day period maps.
ClimatView
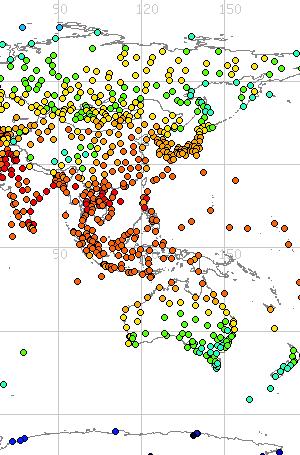
The ClimatView tool enables viewing and downloading of global or continental-scale maps of monthly world climate data, including temperature and precipitation and related anomalies, normals, and 3-, 6-, and 12-month SPI. ClimatView is produced by the Japan Meteorological Agency with input from the World Meteorological Organization members around the world.
GEOGLoWS
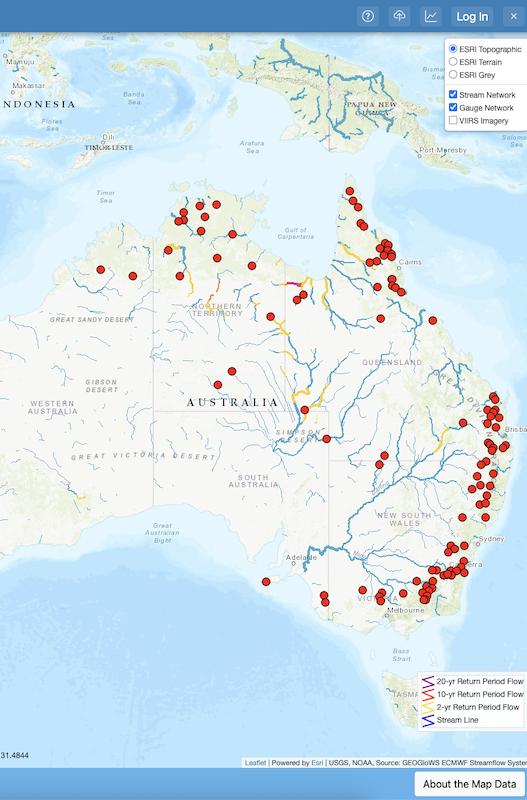
The GEO-Global Water Sustainability Initiative (GEOGloWS) is an interagency (NASA, NOAA, and USGS) collaboration that promotes the GEO data-sharing principles and data management for improved water resource management. GEOGLoWS is an open and free web-based service providing hydrological forecasts and 80 years of historical data for every stream within its 7 million stream network worldwide.
Worldwide Humanitarian Alert Systems
FEWS NET
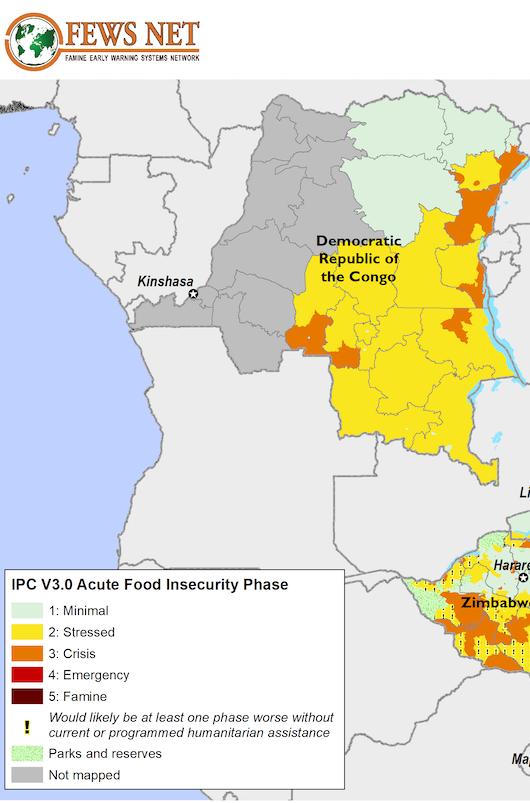
The Famine Early Warning Systems Network (FEWS NET) provides monthly reports and maps for approximately 30 countries detailing current and projected food insecurity in order to inform planning and humanitarian response. Created and managed by the United States Agency for International Development, FEWS NET examines the performance of rainfall (onset, totals, distribution, cessation) at various points in the year, together with forecasts, and develops scenarios of food security projections.

Global Disaster Alert and Coordination System (GDACS)
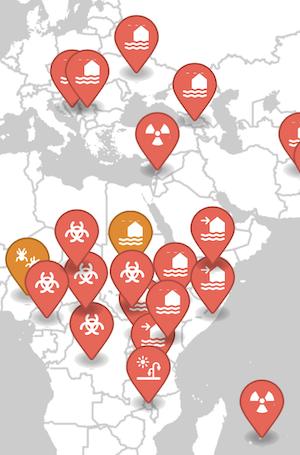
GDACS provides a map of disaster alerts—including drought—worldwide to improve alerts, information exchange and coordination for disasters. This is produced as a cooperative framework between the United Nations, the European Commission, and disaster managers worldwide.
ReliefWeb
The United Nations Office for the Coordination of Humanitarian Affairs provides information services via ReliefWeb on severe disasters—including drought and heat waves—in highly vulnerable countries. The goal is to help humanitarian workers and decision makers make informed decisions to mobilize to address disasters. ReliefWeb monitors and collates information from several sources, including humanitarian agencies at international and local levels, governments, research institutions, and the media.
International Drought Resources
Regional Drought Monitoring Systems
Africa
IGAD Climate Prediction and Applications Centre (ICPAC)
University of Southamption's African Flood and Drought Monitor
Asia
South Asia Drought Monitoring System
Australia
Australian Government Bureau of Meteorology
Caribbean
Caribbean Regional Climate Center
Europe
The European Drought Observatory (EDO)
Latin America
The Desertification, Land Degradation, and Drought (DLDD) Observatory for Latin America
Mesoamerica
North America
North American Drought Monitor (comprising the Canadian Drought Monitor, Mexico Drought Monitor, and U.S. Drought Monitor)
South America
Southern Africa
Southern Africa Development Community
West Africa

