WestWide Drought Tracker (WWDT) - Gridded Monthly Drought Indices for Western U.S.
Western Regional Climate Center (WRCC)
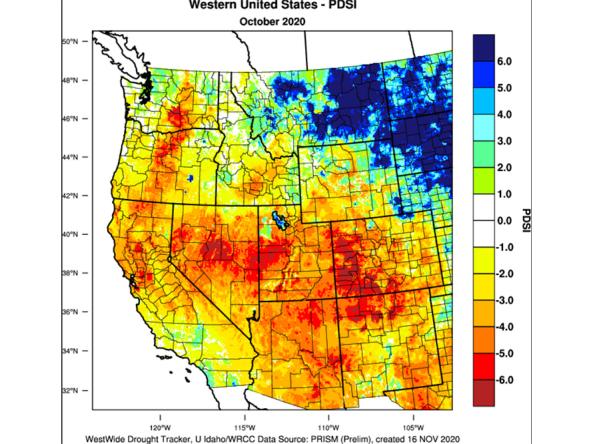
The western United States consists of complex terrain where local precipitation and temperature can vary dramatically across short distances, which in turn impact local drought conditions. The goal of WestWide Drought Tracker (WWDT) is to provide easy access to fine-scale drought monitoring and climate products that can be utilized by a variety of users. The climate data sets, drought indices, and maps that are found on WWDT use monthly data which are updated with new values at the beginning of each month using data from the PRISM Climate Mapping Program.
Drought Indices:
- Palmer Drought Severity Index (PDSI)
- Self-Calibrated Palmer Drought Severity Index (sc-PDSI)
- Palmer Z-Index
- Standardized Precipitation Index (SPI)
- Standardized Precipitation Evapotranspiration Index (SPEI)
How to
How to use this site:
- Current maps – use the “Climate Products Options” to view the latest map
- Archived maps – select “Archived Maps” tab. Select the Year and Month to view previous maps
- Download data – select “Download” tab. Select “wget bash script for downloading files” under “Select Format.” Select variable, month(s), time scale (if applicable) and select “Download File.”
Access
Gridded Drought Indices Images: West Wide Drought Tracker monthly gridded images
Archived images: view previous maps
Download Gridded Drought Indices: select variable, month(s) and time scale (if applicable)
Documentation