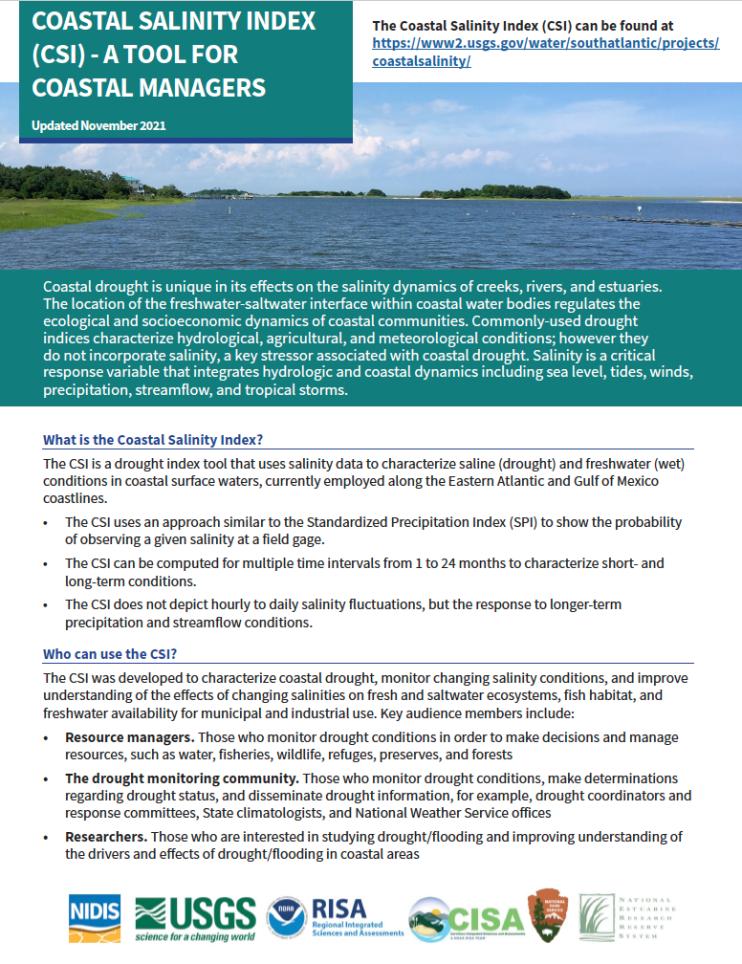
Coastal Salinity Index (CSI) - A New Tool for Coastal Managers
Fact Sheet Updated November 2021
Coastal drought is unique in its effects on the salinity dynamics of creeks, rivers, and estuaries. The location of the freshwater-saltwater interface within coastal water bodies regulates the ecological and socioeconomic dynamics of coastal communities. Commonly-used drought indices characterize hydrological, agricultural, and meteorological conditions; however they do not incorporate salinity, a key stressor associated with coastal drought. Salinity is a critical response variable that integrates hydrologic and coastal dynamics including sea level, tides, winds, precipitation, streamflow, and tropical storms.
What is the Coastal Salinity Index?
The CSI is a drought index tool that uses salinity data to characterize saline (drought) and freshwater (wet) conditions in coastal surface waters, currently employed along the Eastern Atlantic and Gulf of Mexico coastlines.
- The CSI uses an approach similar to the Standardized Precipitation Index (SPI) to show the probabilityof observing a given salinity at a field gage.
- The CSI can be computed for multiple time intervals from 1 to 24 months to characterize short- andlong-term conditions.
- The CSI does not depict hourly to daily salinity fluctuations, but the response to longer-termprecipitation and streamflow conditions.
Who can use the CSI?
The CSI was developed to characterize coastal drought, monitor changing salinity conditions, and improve understanding of the effects of changing salinities on fresh and saltwater ecosystems, fish habitat, and freshwater availability for municipal and industrial use. Key audience members include:
- Resource managers. Those who monitor drought conditions in order to make decisions and manageresources, such as water, fisheries, wildlife, refuges, preserves, and forests
- The drought monitoring community. Those who monitor drought conditions, make determinationsregarding drought status, and disseminate drought information, for example, drought coordinators andresponse committees, State climatologists, and National Weather Service offices
- Researchers. Those who are interested in studying drought/flooding and improving understanding ofthe drivers and effects of drought/flooding in coastal areas
What does this tool provide?
This free, online tool has many functions, including:
- Interactive map showing current conditions of CSI gages within the network
- Access to real-time CSI data for gages within the network
- Maps and graphs for weekly trends of salinity, water temperature, and gage-height, as an indicator of recent hydrological conditions
- Data and graphs for monthly salinity averages
- Downloadable software (R-package), to encourage the use of CSI in current and future research efforts
- Access to historic CSIs
- A CSI User Guide
What are the future plans for the CSI?
- Advance key research questions. Better understand how salinity information can be incorporated into short and long-term planning in areas such as fisheries (e.g., oysters, crabs), conservation (e.g., wetlands), and water (e.g., municipal utilities) management.
- Expand use of CSI applications in coastal decision making. Develop more case studies of how the CSI can be utilized or improved.
- Incorporate the CSI into other decision support tools. Include the CSI in the USGS Coastal Data and Analysis Tool for Water Resources Management website – which is being created to aid coastal water resources management.
- Increase number and spatial coverage of monitoring sites. Explore inclusion of more real-time gage stations on the west coast and along the eastern seaboard and the Gulf of Mexico where there are gaps in data.
Questions or Suggestions?
For more information, please contact Matthew Petkewich, U.S. Geological Survey, at mdpetkew@usgs.gov.
The motivation for a coastal drought index came from the National Integrated Drought Information System (NIDIS) Drought Early Warning System (DEWS) program for coastal North Carolina and South Carolina.


