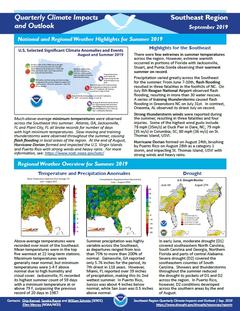
Quarterly Climate Impacts and Outlook for the Southeast Region for June – August 2019. Dated September 2019.
Above-average temperatures were recorded over most of the Southeast. Summer precipitation was highly variable across the Southeast, as departures ranged from less than 75% to more than 200% of normal.
Quarterly Climate Impacts and Outlook for the Chesapeake Bay Region for June – August 2019. Dated September 2019.
Temperature was above normal for much of the region throughout the summer months, and July ranked as one of the ten all-time warmest months on record for several locations. High intensity rainfall events occurred throughout the Chesapeake Bay watershed, resulting in two rare National Weather Service Flash Flood Emergencies.

Quarterly Climate Impacts and Outlook for the Northeast Region for June – August 2019. Dated September 2019.
The Northeast's summer average temperature was 0.8°F above normal, ranking in the warmest third of all years. The Northeast received 108% of normal precipitation during summer, ranking in the wettest third of all years.

Quarterly Climate Impacts and Outlook for the Western Region for June – August 2019. Dated September 2019.

Quarterly Climate Impacts and Outlook for the Missouri River Basin June – August 2019. Dated September 2019.
This summer, temperatures were largely near normal; however, minimum temperatures were slightly above normal, while maximum temperatures were below normal. Meanwhile, extremes in precipitation occurred across the region. This summer's wet conditions were a further continuation of a generally wet pattern that has been in place since last year.

Quarterly Climate Impacts and Outlook for Hawaii and the U.S. Pacific Islands Region for June – August 2019. Dated September 2019.
Includes significant events, regional climate overview, and sectoral impacts for June – August 2019; regional outlook for September – November 2019.

Quarterly Climate Impacts and Outlook for Alaska and Northwestern Canada for March – May 2019; outlook for July – September 2019. Dated June 2019.
Most of Alaska, Yukon, the western portion of the Northwest Territories (NT) and northern British Columbia (BC) were significantly warmer than normal during this past spring, with some areas in Yukon, and the NT near record warmth. In contrast, a small area in northwestern BC was colder than normal. Temperatures over the remainder of BC averaged near normal.

Quarterly Climate Impacts and Outlook for the Great Lakes Region for March – May 2019. Dated June 2019.
Across much of the basin, spring averaged out to be colder than normal, with temperatures as much as 3°C (5°F) below normal while the far southeastern areas were near normal for the spring. Spring precipitation ranged from 101% to 118% of average.

Quarterly Climate Impacts and Outlook for the Southern Region for March – May 2019. Dated June 2019.
Spring temperatures exhibited a west-to-east pattern across the region in general, with above normal temperatures in the east and normal to slightly below normal temperatures in the western states. Spring precipitation was primarily above normal across the Southern Region.

Quarterly Climate Impacts and Outlook for the Missouri River Basin March – May 2019. Dated June 2019.
Average temperatures generally ranged from 2-8°F below normal, with the greatest departures in the upper Basin. Precipitation, on the other hand, was extreme, with spring totals exceeding 150% of normal in many areas.