On July 14, 2021, the National Integrated Drought Information System (NIDIS) hosted an informational webinar on the Climate Program Office FY22 Coping with Drought competition on Ecological Drought.
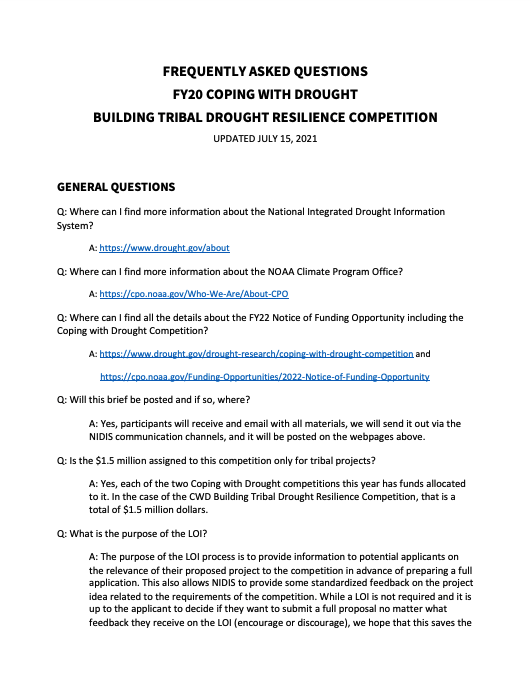
For Fiscal Year (FY) 2022, the National Integrated Drought Information System (NIDIS) is hosting a research competition, Coping with Drought: Building Tribal Drought Resilience. Applications should be developed by or in full partnership with tribal nations to fund the implementation of actions—together with research on those actions—to build drought resilience contained in existing plans and strategies. Plans may include, but are not limited to drought contingency plans; drought, water, or natural resource plans; agricultural resource management plans; or climate adaptation plans.

As of July 13, 2021, 89% of the West is in drought and 25% is in Exceptional (D4) Drought. Both are U.S. Drought Monitor records. Much of the West was drought free just over 14 months ago, but drought conditions began developing around May 2020. A poor summer 2020 monsoon season followed by snow drought in winter 2020-21 worsened conditions in California and the Southwest. Record-shattering temperatures and dry conditions in the Northwest in early summer 2021 caused conditions to rapidly deteriorate in a region that was already facing multi-year precipitation deficits.
For Fiscal Year (FY) 2022, the National Integrated Drought Information System (NIDIS) is hosting a research competition, Coping with Drought: Building Tribal Drought Resilience. Applications should be developed by or in full partnership with tribal nations to fund the implementation of actions—together with research on those actions—to build drought resilience contained in existing plans and strategies. Plans may include, but are not limited to drought contingency plans; drought, water, or natural resource plans; agricultural resource management plans; or climate adaptation plans.
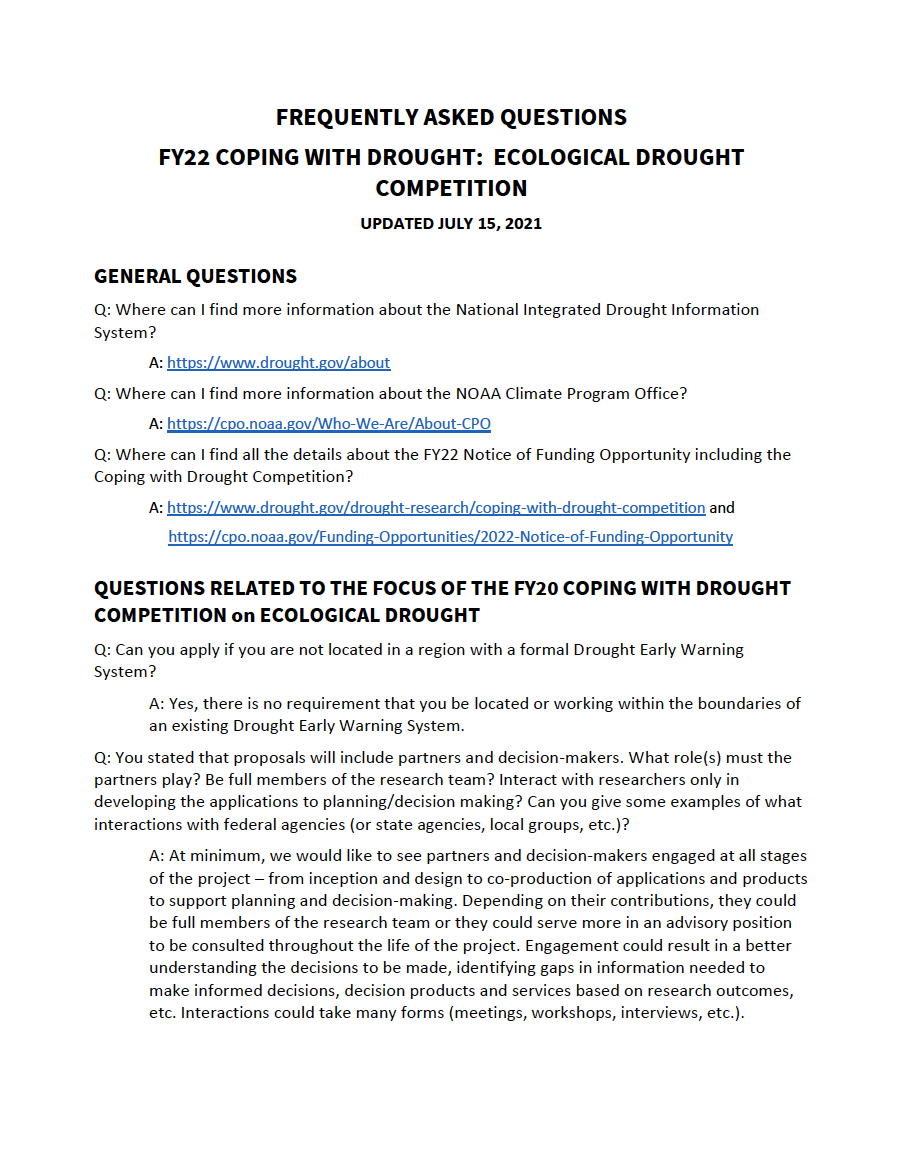
For Fiscal Year (FY) 2022, the National Integrated Drought Information System (NIDIS) is hosting a Coping with Drought research competition focused on ecological drought. This competition will be focused on research to improve our understanding, early warning and management of drought risk in terrestrial and aquatic ecosystems to inform more deliberate and expanded decision-making that supports sustainable, healthy and resilient ecosystems.
NIDIS will periodically update this list of frequently asked questions about the competition. Last updated July 15, 2021.
This drought update is issued in partnership between the National Integrated Drought Information System (NIDIS), National Oceanic and Atmospheric Administration (NOAA) National Weather Service, and the U.S. Department of Agriculture (USDA), and the University of the Virgin Islands. The purpose of the update is to communicate a potential area of concern for drought expansion and/or development within Puerto Rico and the U.S. Virgin Islands based on recent conditions and the upcoming three month forecast.

Quarterly Climate Impacts and Outlook for the Southern Region for March - May 2021. Dated June 2021.
On the whole, temperatures during Spring 2021 averaged quite close to normal in the Southern Region. Spring 2021 featured more than double the normal rainfall amounts in many parts of the Gulf Coast from South Texas to Mississippi. Most of the region received above-normal precipitation.

As of June 22, 2021, 90% of the Southwest and California is in drought, with 40% of this region in Exceptional Drought (D4), the highest level. Twelve months prior, most of the West was drought-free, but drought conditions began developing around May 2020. High temperatures and very low rainfall totals through spring and summer of 2020 set new records across the Southwest, and the combination of extremely low soil moisture leading into winter and snow drought through winter means that run-off in the spring of 2021 has been very low.

Quarterly Climate Impacts and Outlook for the Midwest Region for March - May 2021. Dated June 2021.

Quarterly Climate Impacts and Outlook for the Missouri River Basin March - May 2021. Dated June 2021.
There were stark differences in both temperature and precipitation across the region this spring. Temperatures were, for the most part, near to below normal across much of the west and south, and near to above normal across the east. Meanwhile, heavy precipitation fell across southern areas and little to none fell across the north.