NASA DEVELOP Analyzes Drought Impacts on Urban Tree Recovery in Texas
In 2011, Texas experienced severe agricultural loss, wildfires, and widespread tree mortality in its worst drought since 2000. According to the US Drought Monitor, more than 80% of Texas land area experienced exceptional drought conditions from the spring of 2011 to the beginning of 2012. Other drought monitoring indices, such as The Standardized Precipitation-Evapotranspiration Index (SPEI) and Standardized Precipitation Index (SPI), show similar stories of severe drought in Texas during this time. While these tools are useful for looking at drought conditions at the state level, measuring the local impacts of drought, such as tree mortality, is often challenging.
Measuring Tree Mortality Related to Drought
Based on estimates from the Texas A&M Forest Service (TFS), the severe conditions in Texas during the 2011-2012 drought affected about 300 million trees and killed an estimated 5.6 million urban shade trees. Determining these estimates currently requires resource-intensive in situ data collection methods. To investigate if satellite data can be used instead to provide estimates on how urban trees respond to widespread drought, TFS and the U.S. Forest Service Southern Research Station partnered with the NASA DEVELOP program. NASA DEVELOP teams complete rapid research projects in 10 weeks with guidance from NASA and partner science advisors. The research projects focus on addressing local and international community concerns utilizing NASA's Earth observations.
This project, titled "Analyzing Drought-related Impacts on Urban Tree Inventory Conditions and Recovery in Texas" and completed in the Spring of 2019, was supported by NIDIS and based at NOAA’s National Centers for Environmental Information (NCEI) in Asheville, North Carolina.
Using Remote Sensing Data to Estimate Tree Death and Recovery
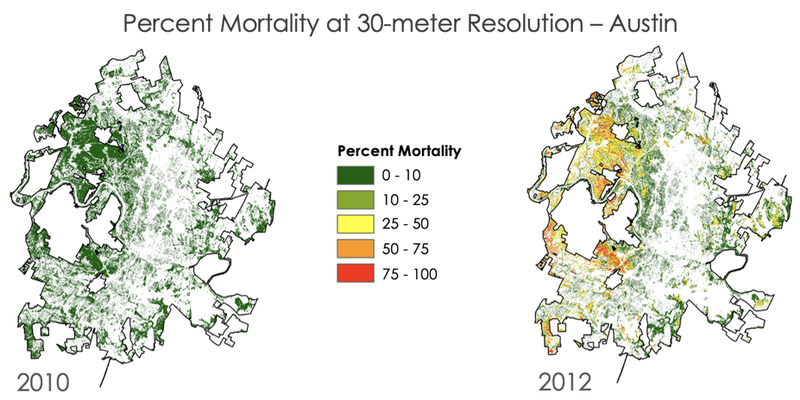
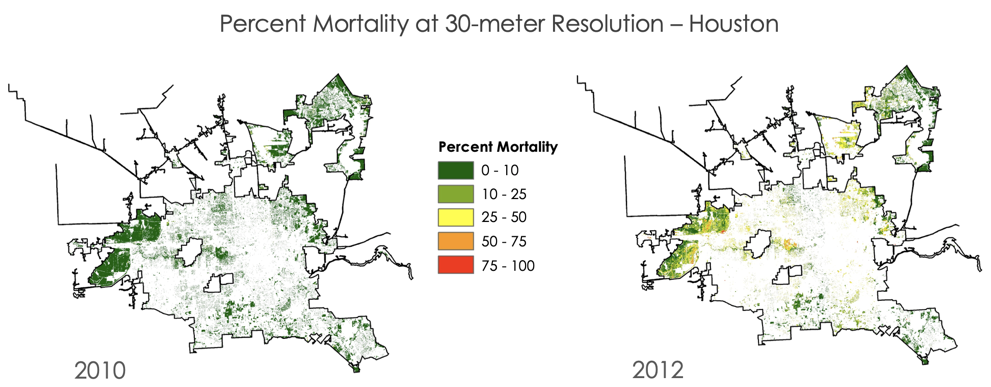
The main objectives of this NASA DEVELOP project were to demonstrate how remote sensing information could be used to measure tree mortality rates related widespread drought, and find connections between tree mortality and vegetation indices, such as the normalized difference vegetation index (NDVI). The study focused on undeveloped green areas (urban forests) in two Texas cities, Austin and Houston, from 2010 to 2018 to show the immediate effects of the 2011 drought and trends in recovery.
The project team utilized three methods to create 30 meter resolution aggregation maps of tree canopy mortality:
Tree Cover Isolation
The first step in determining tree mortality was to acquire city-wide high resolution data for both the pre- and post-drought period. Using data from the USDA National Agriculture Imagery Program (NAIP) collection of aerial imagery, the team created high resolution images of Houston and Austin for 2010 and 2012. Next, they used NDVI and focal statistics to build a “texture layer” to better distinguish between tree canopy and healthy grass or shrub coverage. The result was a raster map representing the total extent of tree coverage for each city in 2010.
Mortality Detection
After creating the 2010 tree cover isolation layer, the team applied the mask layers to the 2012 high resolution imagery. This limited the extent of the 2012 images to areas they knew were tree canopy. They then ran a separate unsupervised (calculated by software) classification on both 2010 NAIP imagery and 2012 NAIP imagery to visually distinguish between dead and live canopy. Reclassifying the dead/live canopy created a “percent mortality” layer.
Landsat Aggregation
With the tree mortality map created, the team aggregated the 1 meter resolution up to 30 meters in order to easily compare to Landsat data, which has a 30 meter resolution. However, when scaling up from 1 meter to 30 meters, the map includes larger areas of the city, as well as buildings and pavement, which would skew the model. To adjust for this in their model, the participants selected for areas of the 30 meter percent mortality layer that were at least 50% forested.
Project Conclusions and Future Work
The resulting model shows a drastic change in urban tree mortality rates pre- and post-drought. In Austin, their model estimates that tree mortality went from 1.75 percent in 2010 to 19.64 percent in 2012. Similarly, Houston also experienced canopy mortality rate increases from about 1.99 percent in 2010 to 19.56 percent in 2012. The similarity in overall increase in canopy mortality rates suggests that the trees in both cities have a similar response to drought events.
The project found that their model generally overpredicted tree mortality, but it performed well for moderate values. This model will be provided to TFS, who can use it to further explore the relationship between NDVI anomalies and changes in tree canopy cover in Austin, Houston, or other cities.
Future work is needed to validate the model with high-quality, ground truth data, such as the Forest Inventory and Analysis data. While the participants had access to some urban tree inventory datasets, there wasn’t in situ data available for the project’s period of interest. Validation with ground truth data is key to strengthening their model and using remote sensing data to estimate tree mortality in the future.
 NASA DEVELOP at NCEI
Since 2014, NCEI has hosted approximately 10-15 participants each year from the NASA DEVELOP program to conduct collaborative projects between NASA and NOAA. These projects demonstrate to partner organizations how NASA and NOAA remote sensing imagery can be used in water resource management, disaster response, ecological forecasting, and other applications. Embedded within NCEI's Center for Weather and Climate, the NASA DEVELOP location at NCEI provides participants with direct access to renowned meteorologists and climatologists as well as to NOAA's Regional Climate Service Directors as well as many other NOAA organizations.
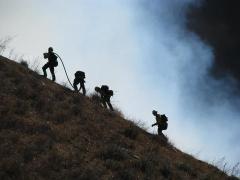
In 2018, another NCEI-based, drought-related NASA DEVELOP project worked to improve the Fire Risk Estimation (FIRE) Matrix for the Upper Missouri River Basin by incorporating drought indicators along with fire risk. The project utilized NASA Earth Observations and NOAA Climate Data Records to produce climate indications of rangeland health and the risk of severe wildfire, which are now used by fire managers for decision support.
In 2017, another NASA DEVELOP project produced the FIRE Matrix utilizing NASA Earth Observations and NOAA Climate Data Records to produce climate indications of rangeland health and the risk of severe wildfires, which are now used by fire managers in the Bureau of Indian Affairs and state of South Dakota for decision support. NIDIS, the NOAA Centers for Environmental Information, and NASA DEVELOP came together on a project that addresses these recommendations to improve the FIRE Matrix and improve the tool’s capacity to facilitate wildfire management decisions.
More information about the FIRE Matrix NASA DEVELOP Project can be found on NCEI’s website.
NIDIS supports projects, such as NASA DEVELOP, that enhance the skill with which models and prediction systems can assess past and future drought conditions and use the resulting data to improve drought preparedness. Please visit our Research page to learn more about NIDIS-supported research.