2017’s Billion-Dollar Disasters
The National Centers for Environmental Information (NCEI) has released the 2017 Billion-Dollar Weather and Climate Disasters report, which reveals that 2017 shattered the previous cumulative damage record of $214.8 billion (inflation-adjusted), set in 2005, by nearly another $100 billion. This is even more significant given that 2005 was the historic and unforgettable year that brought Hurricanes Dennis, Katrina, Rita, and Wilma.
In 2017, the United States experienced 16 weather and climate disaster events with losses exceeding $1 billion each, for a total cumulative damage cost of $306.2 billion. These 16 events included:
- 1 drought event
- 2 flooding events
- 1 freeze event
- 8 severe storm events
- 3 tropical cyclone events
- 1 wildfire event
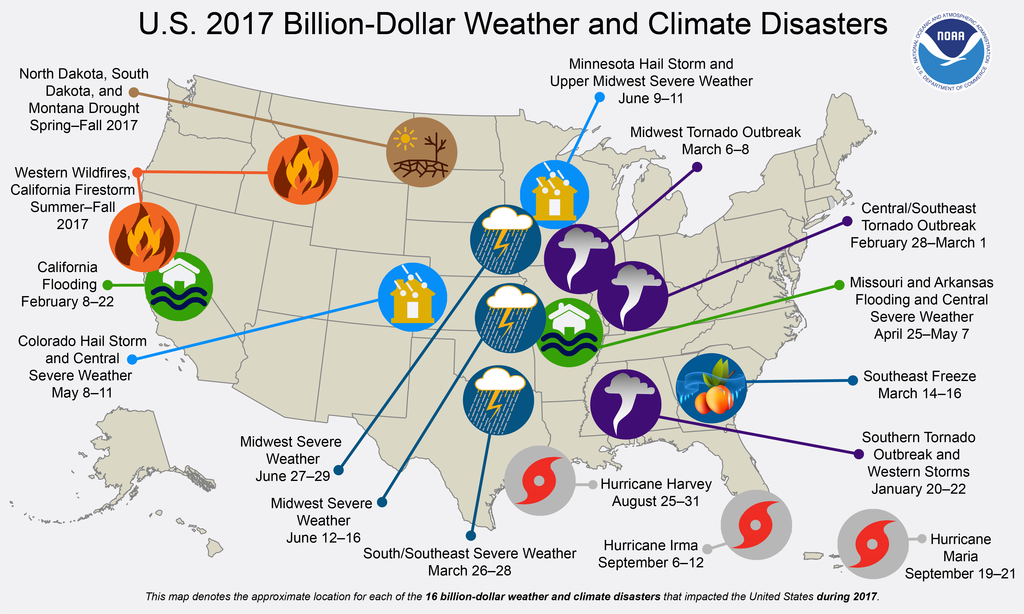
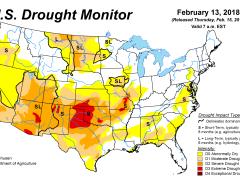
The drought event in this report was the North Dakota, South Dakota, and Montana Drought that lasted from March to December and caused $2.5 billion in damage, the most extensive damage hitting agriculture. According to NCEI’s report, “field crops including wheat were severely damaged and the lack of feed for cattle forced ranchers to sell off livestock. This drought has also contributed to the increased potential for severe wildfires,” including wildfires in Montana that burned over 1 million acres.
While 2017 surpassed the cumulative damage record set in 2005, it also tied the record number of events, which was set in 2011. However, according to NCEI, based on the method with which they calculate events, “2017 arguably had more events than 2011” since NCEI’s analysis traditionally counts U.S. billion-dollar wildfires as regional-scale, seasonal events, not as multiple isolated events.
In order to perform cost assessments for weather and climate disasters, NCEI pulls data and statistics from a wide range of sources and calculates “the costs in terms of dollars that would not have been incurred had the event not taken place.” Some of the costs – both insured and uninsured – that are calculated into the total, direct cost include:
- Physical damage to residential, commercial, and government or municipal buildings
- Material assets within a building
- Time loss; (business interruption)
- Vehicles and boats
- Offshore energy platforms
- Public infrastructure (roads, bridges, and buildings)
- Agricultural assets (crops, livestock, and timber)
- Disaster restoration and wildfire suppression costs
According to the report’s author, Adam Smith, “one of the key transformations is scaling up insured loss data to account for uninsured and underinsured losses, which differs by peril, geography, and asset class. However, these loss assessments do not take into account losses to natural capital or assets, health care related losses, or values associated with loss of life. Therefore, our estimates should be considered conservative with respect to what is truly lost, but cannot be completely measured.”
Please see Calculating the Cost of Weather and Climate Disasters for more information.
NCEI also reported that the U.S. has sustained 219 of these billion-dollar disasters since 1980, and the total cost now exceeds $1.5 trillion. Adam Smith also wrote a summary and historical analysis of about the 2017 report, in which he discusses the rising frequency of these major disasters and their different impacts based on geography.
In the 2017 report, NCEI also included a table that described the overall impacts of these disasters, categorized by type, since 1980. Tropical Cyclones accounted for over half (55.3%) of total losses in that time period, and drought came in second, accounting for 15.4% of total losses. Drought also recorded the second-highest average event cost at $9.5 billion per drought (after Tropical Cyclones, again). Considering drought was recorded as the median event in terms of frequency, the amount of loss that droughts caused is even more significant.
| Disaster Type | Number of Events | Percent Frequency | CPI-Adjusted Losses (billions of dollars) |
Percent of Total Losses | Average Event Cost (billions of dollars) |
Deaths |
| Drought | 25 | 11.4% | $236.6 | 15.4% | $9.5 | 2.993† |
| Flooding | 28 | 12.8% | $119.9 | 7.8% | $4.3 | 540 |
| Freeze | 8 | 3.7% | $27.6 | 1.8% | $3.5 | 162 |
| Severe Storm | 91 | 41.6% | $206.1 | 13.4% | $2.3 | 1,578 |
| Tropical Cyclone | 38 | 17.4% | $850.5 | 55.3% | $22.4 | 3,461 |
| Wildfire | 15 | 6.8% | $53.6 | 3.5% | $3.6 | 238 |
| Winter Storm | 14 | 6.4% | $43.1 | 2.8% | $3.1 | 1,013 |
| All Disasters | 219 | 100.0% | $1,537.4 | 100.0% | $7.0 | 9,985 |
† Deaths associated with drought are the result of heat waves. (Not all droughts are accompanied by extreme heat waves.)
NCEI compiles information from the National Weather Service, the Federal Emergency Management Agency, U.S. Department of Agriculture, National Interagency Fire Center, U.S. Army Corps, Energy Information Administration, individual state emergency management agencies, state and regional climate centers, media reports, and the insurance industry.