For the latest forecasts and critical weather information, visit weather.gov.
2024 in Review: A Look Back at Drought Across the United States in 12 Maps
After a warm, dry October, drought reached a nationwide record this year. Ohio and West Virginia saw their greatest area in Extreme and Exceptional Drought (D3-D4) since the U.S. Drought Monitor began in 2000. Far West Texas, southern New Mexico, and the Northern Rockies remained in persistent drought throughout the year. Meanwhile, areas of the West and Southwest in long-term drought saw some improvement in spring.
Overall, A Dry Year in Parts of the Southwest and Northern Plains
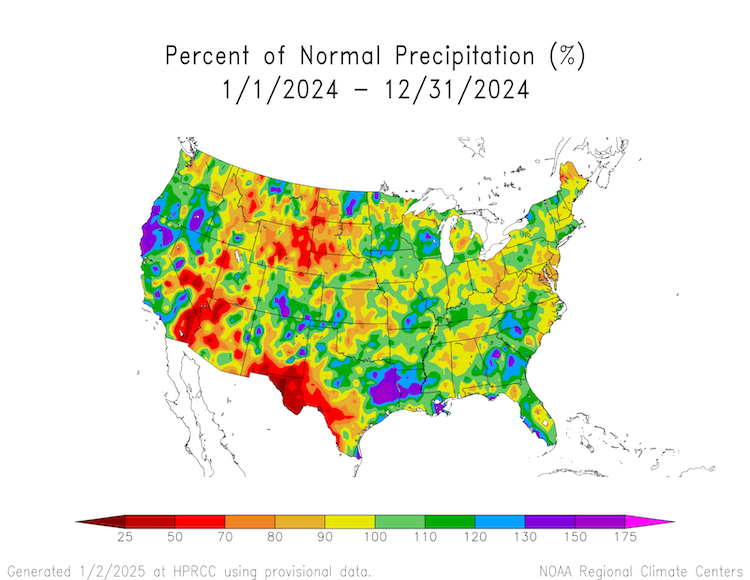
2024 was a year of precipitation extremes, often bouncing around week to week and month to month. A few dry areas stand out on the percent of normal annual precipitation map, including parts of the Northern Plains, Lower Colorado River Basin, and Far West Texas and southern New Mexico. These areas ended the year in Extreme (D3) and Exceptional (D4) Drought. Northern California and parts of the Southeast ended the year wetter-than-normal.
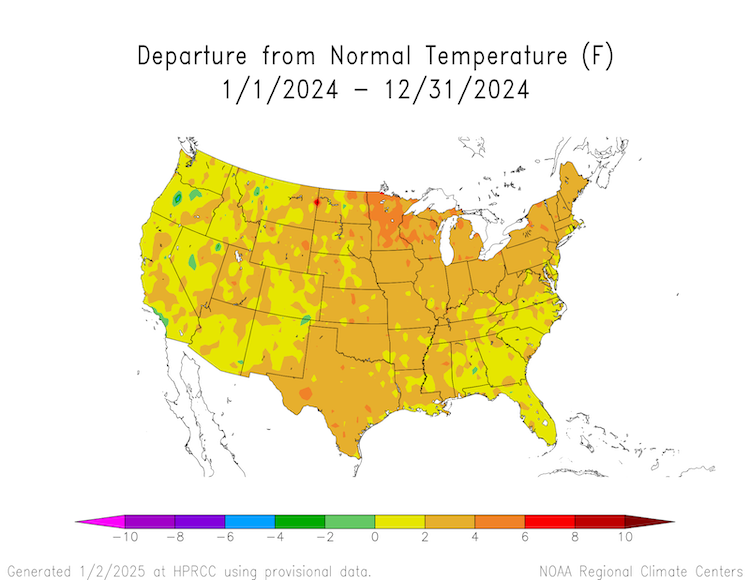
A Warm Year Nationwide in 2024
As shown on the annual departure from normal temperature map, it was a relatively warm year. Across much of the U.S., temperatures were 2–4 degrees above normal. Minnesota was particularly warm: 4–6 degrees above its annual normal temperatures.
Changes in U.S. Drought Coverage
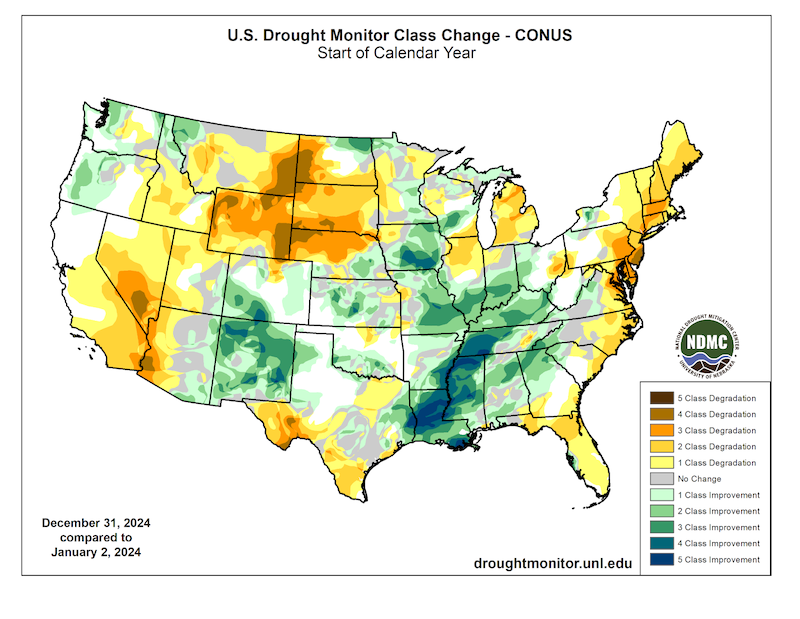
2024 brought a mix of drought degradation and improvement across the Nation. The map below compares conditions on the first U.S. Drought Monitor map on January 2 to the final map of the year on December 31. Compared to January, drought worsened in the Northeast, parts of the Midwest, southern California and Nevada, and in the Northern Rockies and Great Plains. Conditions improved in the Mississippi River Valley, New Mexico, and parts of the Pacific Northwest.
Northern Rockies, Pacific Northwest Kicked Off 2024 with Snow Drought
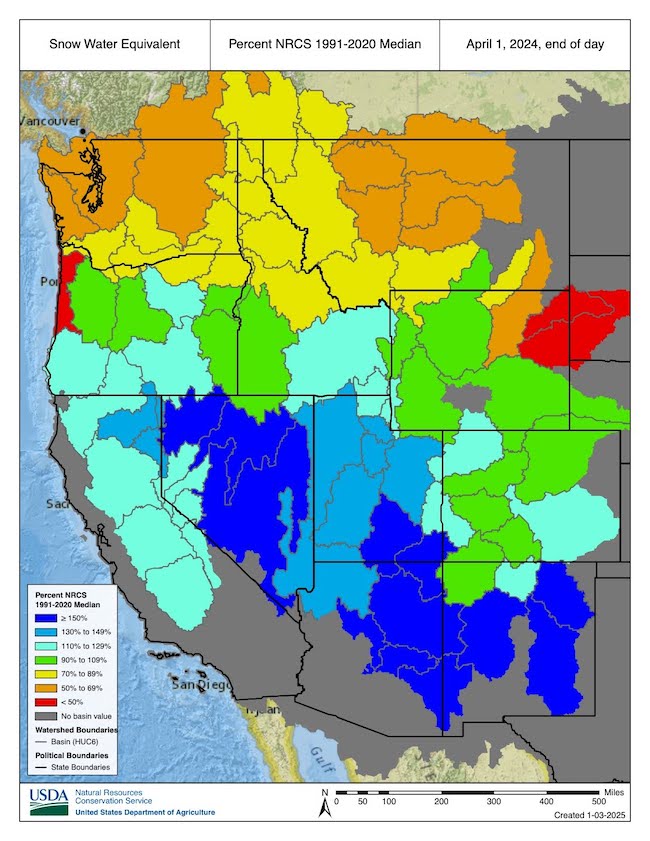
Snow drought conditions developed over much of the western U.S. in the first few months of Water Year 2024 due to above-normal temperatures and lack of precipitation. Some regions improved throughout the winter season (e.g., Sierra Nevada, Great Basin). Others (e.g., northern Rocky Mountains) saw snow drought persist. Below-normal water year precipitation in Washington and the northern Rockies was one of the underlying causes of this year's snow drought and set the stage for further drought development and intensification in the summer.
April often marks peak snowpack conditions in many areas of the West. April 1, 2024 snowpack (shown below as snow water equivalent as a percent of the 1991-2020 median) was below average in the Northern Rockies and Pacific Northwest.
Strong El Niño Brings Wet Winter to Parts of the South, Coastal Pacific Northwest
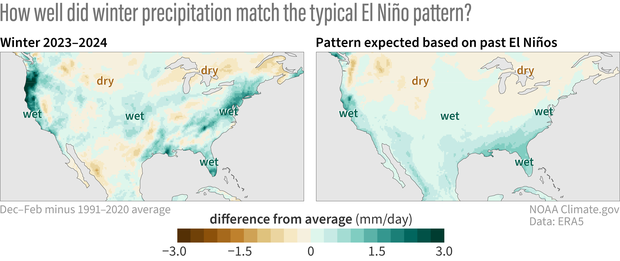
We rang in 2024 with a strong El Niño. El Niño is the warm phase of a natural climate pattern across the tropical Pacific known as the El Niño-Southern Oscillation (ENSO). El Niño drives patterns that alter the seasonal climate, with global impacts. El Niño typically brings warm, dry winters in the northern U.S. and cool, wet winters in the southern U.S.
Winter was wetter than normal overall, with wetter conditions most pronounced across coastal areas, especially the West and Gulf Coasts and from the Mid-Atlantic to the Northeast. Drier-than-average conditions were much less expansive, but below-normal precipitation occurred around the Northern Rockies and portions of the south-central U.S. and extending southward into northern Mexico. Learn more in climate.gov’s ENSO Blog.
A La Niña is favored to emerge soon, with a 59% chance according to the National Weather Service Climate Prediction Center.
Summer Heat Brings Risk of Flash Drought—And New Tools to Predict It
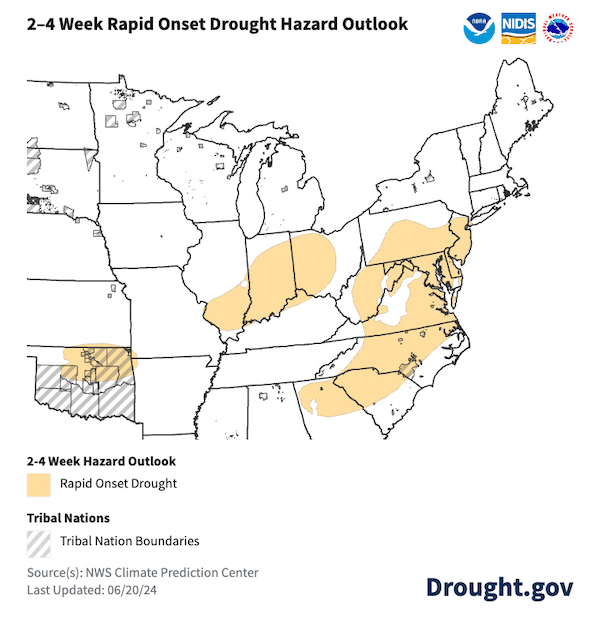
The Rapid Onset Drought hazard outlook product became operational in May 2024 as part of the Climate Prediction Center’s (CPC’s) Day 8–14 U.S. Hazards Outlook. This product highlights areas where rapid drought development (sometimes known as “flash drought”) may occur in the coming 2–4 weeks as depicted by the U.S. Drought Monitor. Forecasters use initial conditions, such antecedent dryness (e.g., soil moisture), and skillful temperature and precipitation outlooks during the next 2 weeks to communicate the risk of rapidly developing drought.
Over the summer, several rapid onset drought forecasts were issued for flash droughts that emerged in the Midwest, Southern Plains, and Southeast.
Rapid Onset Drought risk areas give end users, particularly farmers making decisions about planting and supplemental irrigation, an early warning of the potential for hot and dry conditions. This product supplements CPC’s Monthly Drought Outlook and is an important step toward comprehensive flash drought monitoring and prediction.
Record-Breaking Warm, Dry October
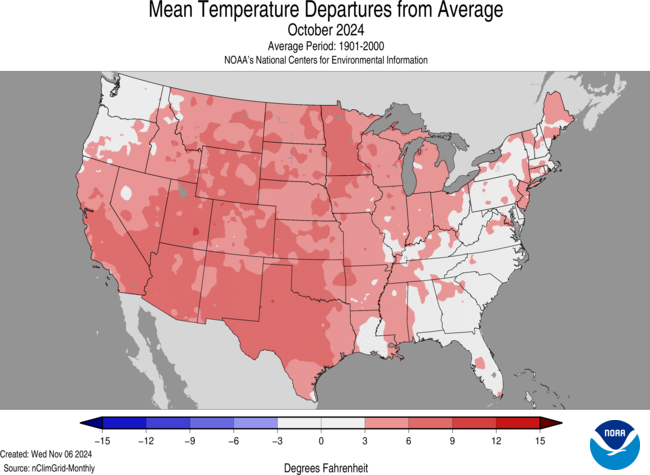
The average temperature of the contiguous U.S. in October was 59.0°F, 4.9°F above average, ranking second warmest in the 130-year record. Generally, October temperatures were record warm across portions of the West and Deep South, with above-average temperatures dominating much of the remainder of the contiguous U.S.
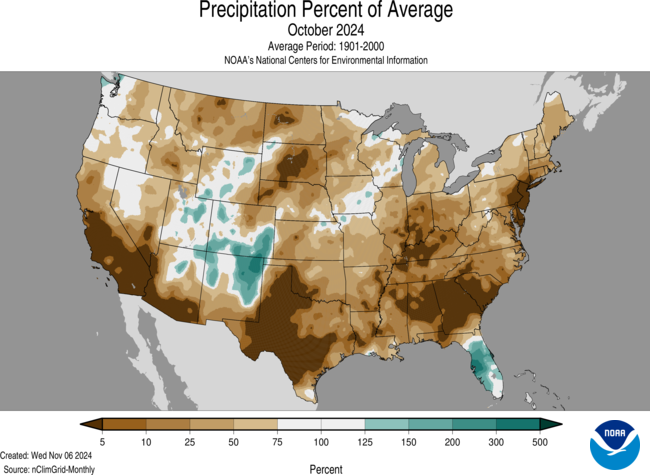
October precipitation for the contiguous U.S. was 0.95 inch, 1.21 inches below average, tying for second driest with October 1963. Precipitation was below average across much of the Lower 48 with pockets of above-average precipitation across portions of the Rockies and Florida. Delaware and New Jersey both had their driest October on record. Nineteen additional states from Texas to the Northeast had a top-10 driest October on record for this period.
Drought Reached Record Levels in Fall 2024
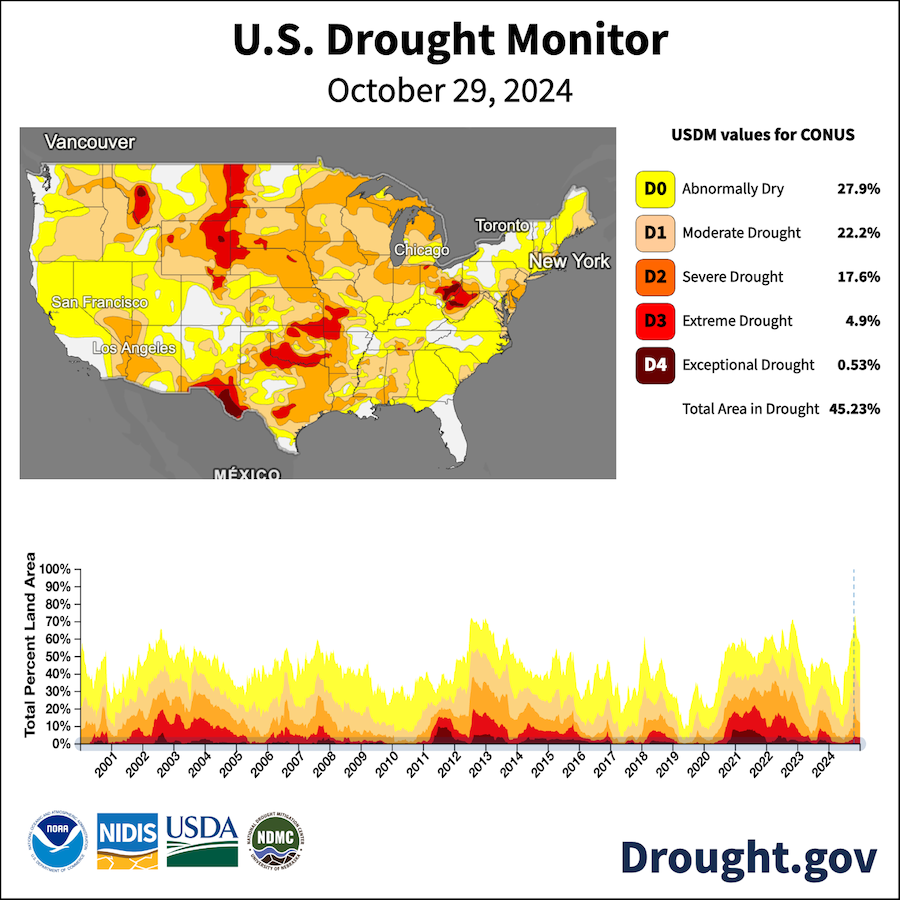
A combination of hot and dry conditions across much of the country in October created record-breaking drought coverage. At the time, 45.3% of the Lower 48 states were in drought, and 73.2% of the Lower 48 was Abnormally Dry (D0) or in drought. Drought was present in every state except Alaska and Kentucky.
Saltwater Creeped Upstream on the Mississippi and Delaware Rivers
Drought brought water levels down on the Mississippi River in the Southeast and Delaware River in the Northeast, allowing saltwater to encroach upstream.
On the Mississippi, in times of extreme low volume water flow, unimpeded salt water can travel upriver and threaten municipal drinking water and industrial water supplies. The river reached that threshold in August 2024, when the U.S. Army Corps of Engineers constructed an underwater sill across the bed of the river to prevent saltwater from moving upstream. The Corps constructed a similar underwater sill in 2022 and 2023 near Myrtle Grove, Louisiana.
On the Delaware, water managers track the seven-day average location of the salt front, the area where water is too salty to safely use for drinking water. In 2024, the salt front moved 17 miles upstream from its average location. Water managers released freshwater from reservoirs to prevent it from moving further upstream, where it could impact community drinking water.
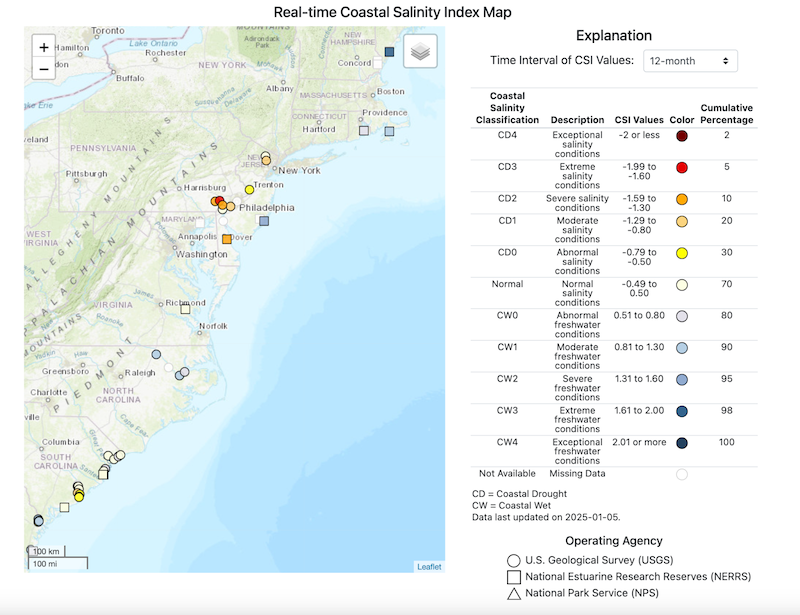
The Coastal Salinity Index (CSI) is a long-term monitoring tool that characterizes relative changes in coastal salinity regimes for salinity gages with long periods of record. The CSI was developed to characterize coastal drought, monitor changing salinity conditions, and improve our understanding of the effects of changing salinities on fresh and saltwater ecosystems, fish habitat, and freshwater availability, providing economic, human health, and environmental benefits. 12-month CSI Values show severe salinity conditions in coastal areas in New York, New Jersey, and Delaware.
Looking Ahead: Hot, Dry Pattern Forecast for the Southern and Eastern U.S.
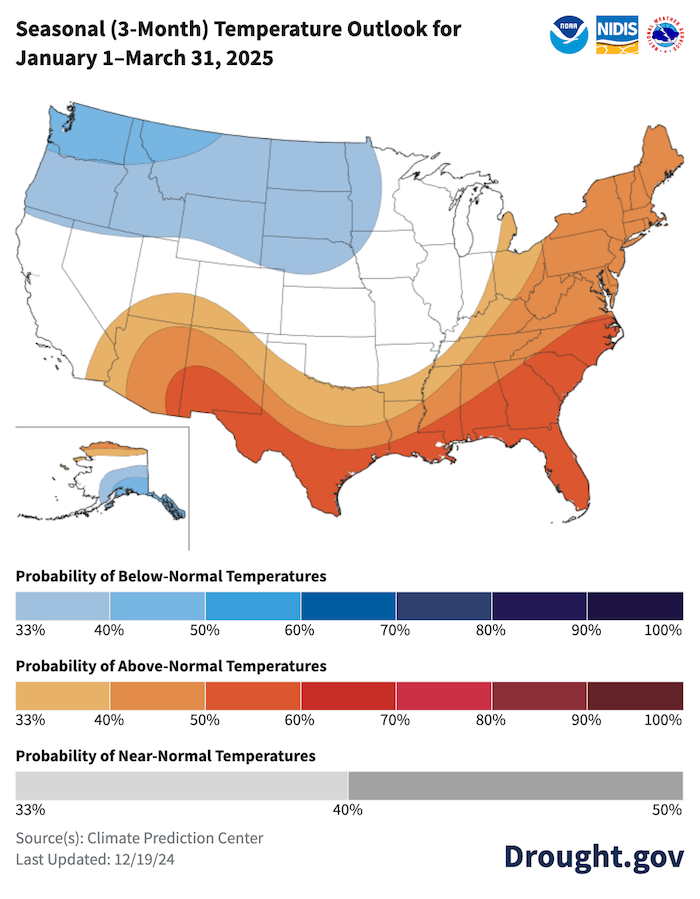
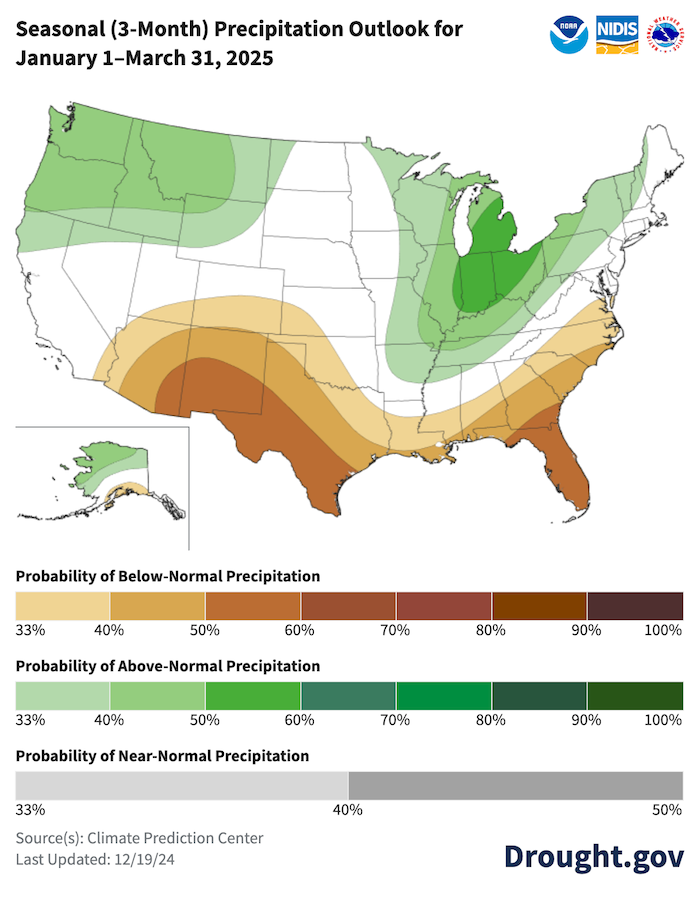
As we kick off 2025, what’s in store for drought? Through March 2025, the National Weather Service’s Climate Prediction Center predicts a pattern similar to a traditional La Niña: warm conditions for the southern and eastern U.S. and dry conditions in the southern U.S.
Areas of the Mid-Atlantic, Texas, and the Southwest currently in drought are favored to continue to see warm, dry conditions that limit drought removal. A forecasted cool, wet pattern may improve dry conditions in the Northern Rockies.
