Emerging Climate Trends Make Monitoring Drought More Complex
Drought management in the U.S. hinges on the quality of our drought monitoring, which is a challenge in a changing climate. The United States Drought Monitor (USDM), a key tool for identifying and categorizing droughts since 2000, uses different categories to describe the intensity of droughts, such as “moderate,” “severe,” or “extreme.” These categories help decision-makers understand how bad a drought is and what actions might be needed.
In a new study by Dartmouth College, published in AGU Advances, scientists examined whether the USDM is keeping up with changes in climate, as expressed in precipitation and soil moisture patterns. It is crucial to understand whether and how drought monitoring reflects long-term climate trends, because the classification of drought shapes our response to its impacts on agriculture, water management, and longer-term emergency planning. This study focused on trends over the past 23 years in regions that often experience drought, like the American West. The study was funded by NIDIS through the NOAA Climate Program Office's Modeling, Analysis, Predictions, & Projections (MAPP) program in Fiscal Year 2020 to help understand the impact of climate change on drought assessment and address these concerns with the USDM and other drought assessment indices and tools.
The results showed that the USDM drought categories have generally reflected observed drier-than-normal hydrologic and warmer-than-normal climate conditions, implying that the USDM is reflecting real-world climate conditions well. However, the most intense drought categories are reported more often than USDM guidelines suggest they should be, implying that the categorical standards used by the USDM to classify drought intensity may no longer match our current reality.
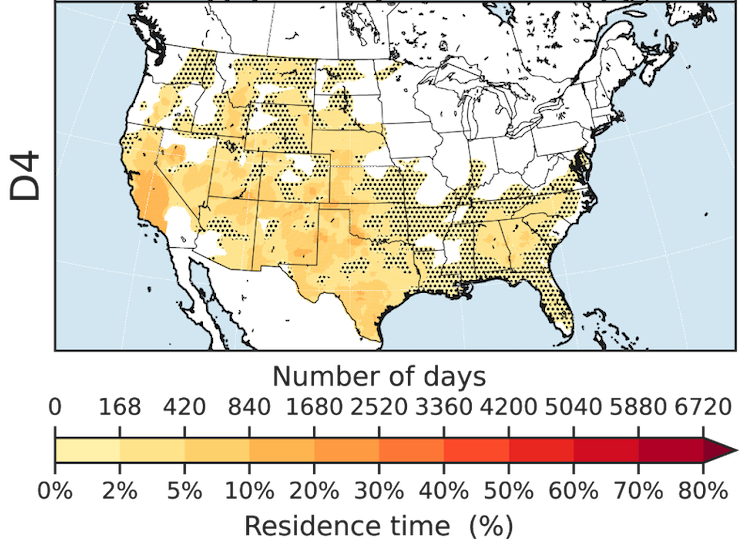
For example, Exceptional Drought (D4) in many U.S. regions is occurring far more often than 2% of the time over the 23-year period from 2000–2022, meaning its residence time (the number of weeks per year a point spent in a given drought classification) from 2000–2022 is inconsistent with USDM guidelines. In some places in the western U.S., D4 is occurring at a residence time of up to 18% of the 2000–2022 period, nine times more than expected (2%). This is likely because changing drought patterns are influenced by climate change and shifts in regional climates.
Particularly in the American West, droughts are lasting longer and are more intense owing to a mix of both climate change and natural climate variability. This raises questions about whether the methods used to monitor and classify droughts are still effective. This research highlights the need to regularly update and revise our methods to classify droughts with the most accurate and up-to-date information. This is crucial to plan and respond effectively to drought conditions.