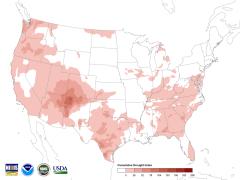
The High Cost of Drought
NOAA’s National Centers for Environmental Information (NCEI) tracks U.S. weather and climate events that have great economic and societal impacts (www.ncdc.noaa.gov/billions). Since 1980, the U.S. has sustained 258 weather and climate disasters where the overall damage costs reached or exceeded $1 billion (including adjustments based on the Consumer Price Index, as of January 2020). Among these, 26 droughts cost the nation at least $249 billion, with an average cost of more than $9.6 billion incurred during each event. Only hurricanes were more costly. The cumulative cost for all 258 events exceeds $1.75 trillion.
The number and cost of disasters are increasing over time due to a combination of increased exposure (i.e., values at risk of possible loss), vulnerability (i.e., how much damage does the intensity [wind speed, flood depth] at a location cause) and that climate change is increasing the frequency of some types of extremes that lead to billion-dollar disasters (NCA 2018, Chapter 2).
Number of events
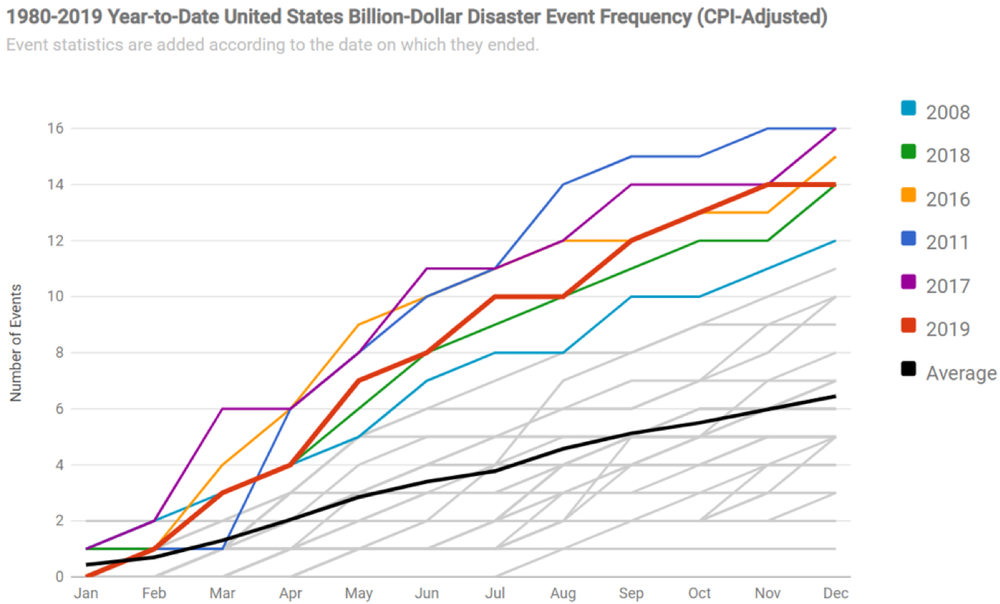
The U.S. has experienced 69 separate billion-dollar disaster events over the last 5 years (2015-2019), an inflation-adjusted average of 13.8 events per year. Over the last 40 years (1980-2019), the years with 10 or more separate billion-dollar disaster events include 1998, 2008, 2011-2012, and 2015-2019.
Cost comparisons
The costliest U.S. disaster years on record are 2017 ($318.9 billion), 2005 ($226.1 billion), and 2012 ($130.9 billion) when all years are inflation-adjusted to January 2020 dollars. The 40-year annual cost average for billion-dollar disasters is $43.9 billion (CPI-adjusted), as noted by the black line in the following chart.
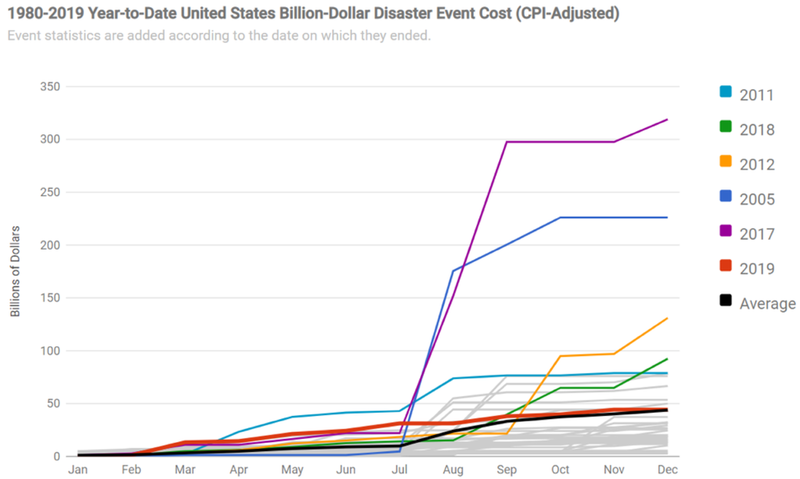
This graphic depicts the cumulative estimated cost of billion dollar weather and climate disasters on a monthly basis for each year since 1980. Driven by enormous losses from hurricanes, 2017 (purple line) and 2005 (dark blue line) stand head and shoulders above the rest of the pack. Screenshot from NOAA NCEI Billion-dollar Disasters webpage.
In broader context, the total cost of U.S. billion-dollar disasters over the last 5 years (2015-2019) exceeds $525 billion, with a 5-year annual cost average of $106.3 billion (CPI-adjusted), both of which are records. The U.S. billion-dollar disaster damage costs over the last decade (2010-2019) were also historically large, exceeding $800 billion from 119 separate billion-dollar events. Moreover, the losses over the most recent 15 years (2005-2019) are $1.16 trillion in damage from 156 separate billion-dollar disaster events.
2010-2019: an unprecedented decade of billion-dollar disasters
After adjusting for inflation, the U.S. experienced more than twice the number of billion-dollar disasters during the 2010s than the 2000s decade: 119 versus 59. Indeed, increased urbanization and material exposure to extreme event impacts is a large driver of the increasing losses, even after taking into account the rising cost of inflation.
| Number of Billion-Dollar Disasters (average per year) | Associated Costs (average per year) | Associated Fatalities (average per year) | |
|---|---|---|---|
| 1980s (1980-1989) | 28 (2.8) | $127.7B ($12.8B) | 2,808 (281) |
| 1990s (1990-1999) | 52 (5.2) | $269.6B ($27.0B) | 2,173 (217) |
| 2000s (2000-2009) | 59 (5.9) | $510.3B ($51.0B) | 3,051 (305) |
| 2010s (2010-2019) | 119 (11.9) | $802.0B ($80.2B) | 5,212 (521) |
| Last 5 years (2015-2019) | 69 (13.8) | $531.7B ($106.3B) | 3,862 (772) |
| Last 3 years (2017-2019) | 44 (14.7) | $456.7B ($152.2B) | 3,569 (1,190) |
| Overall (1980-2019) | 258 (6.5) | $1.754.6B ($43.9B) | 13,249 (331) |
Four of the five most costly U.S. billion-dollar disasters occurred in the 2010s (i.e., Hurricanes Harvey, Irma, Maria, and Sandy). In addition, the two most destructive and costly wildfire seasons in U.S. history have taken place over the last three years, with losses exceeding $40 billion, with much of this damage in California.
Worrisome trends
Keep in mind that these estimates do not reflect the total cost of U.S. weather and climate disasters, only those associated with events in excess of $1 billion in damages. However, these extreme events do account for the majority (>80%) of the damage from all recorded U.S. weather and climate events (NCEI; Munich Re). These billion-dollar disaster events are becoming an increasingly larger percentage of the cumulative damage from the full distribution of weather-related events at all scales and loss levels.
Clearly, the historically large U.S. losses from hurricanes and wildfires over the last few years have further skewed the total distribution of extreme weather costs. This increase reflects a combination of increased exposure, vulnerability and the fact that climate change is playing an increasing role in the frequency of some types of extremes that lead to billion-dollar disasters.
- 1980-2000 …(~75% of full distribution of all disaster-related costs)
- 1980-2010 …(~80% of full distribution)
- 1980-2019 …(~85% of full distribution):
- $1.75 trillion of $2.05 trillion in US weather and climate events costs since 1980
Distribution of costs and fatalities by disaster type
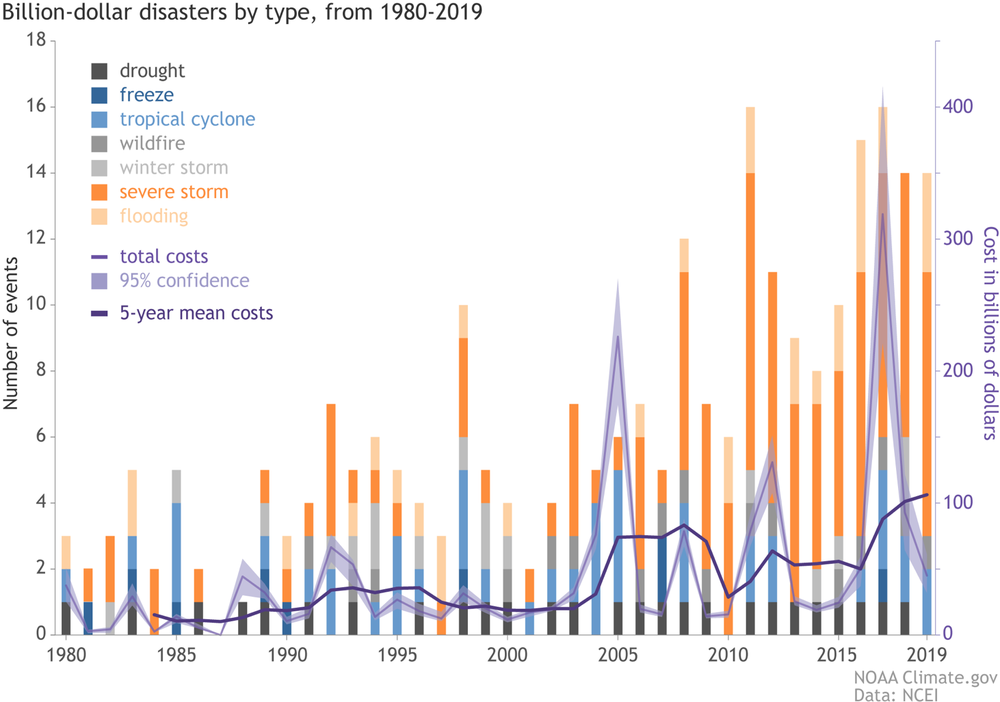
The distribution of damage from U.S. billion-dollar disaster events from 1980–2019 is dominated by tropical cyclone losses. Tropical cyclones have caused the most damage ($945.9 billion) and also have the highest average event cost ($21.5 billion per event). Hurricanes are responsible for slightly more than half (53.9%) of the total losses for all U.S. billion-dollar disasters but represent less than one-fifth (17.1%) of all the billion-dollar events we have assessed since 1980.
Drought ($249.7 billion), severe storms ($247.8 billion), and inland flooding ($146.5 billion,) have also caused considerable damage. Severe storms have caused the highest number of billion-dollar disaster events (113), while the average event cost is the lowest ($2.2 billion). Tropical cyclones and flooding represent the second and third most frequent event types (44 and 32), respectively. Tropical cyclones are responsible for the highest number of deaths (6,502), followed by drought/heatwave events (2,993), and severe storms (1,642).
| Disaster Type | Number of Events | Percent Frequency | CPI-Adjusted Losses (billions of dollars) |
Percent of Total Losses | Average Event Cost (billions of dollars) |
Deaths |
| Drought | 25 | 11.4% | $236.6 | 15.4% | $9.5 | 2.993† |
| Flooding | 28 | 12.8% | $119.9 | 7.8% | $4.3 | 540 |
| Freeze | 8 | 3.7% | $27.6 | 1.8% | $3.5 | 162 |
| Severe Storm | 91 | 41.6% | $206.1 | 13.4% | $2.3 | 1,578 |
| Tropical Cyclone | 38 | 17.4% | $850.5 | 55.3% | $22.4 | 3,461 |
| Wildfire | 15 | 6.8% | $53.6 | 3.5% | $3.6 | 238 |
| Winter Storm | 14 | 6.4% | $43.1 | 2.8% | $3.1 | 1,013 |
| All Disasters | 219 | 100.0% | $1,537.4 | 100.0% | $7.0 | 9,985 |
This table shows the breakdown, by hazard type, of the 258 billion-dollar weather and climate disasters assessed since 1980. † Deaths associated with drought are the result of heat waves. (Not all droughts are accompanied by extreme heat waves.)
The increase in population and material wealth over the last several decades, are an important cause for the rising costs. These trends are further complicated by the fact that much of the growth has taken place in vulnerable areas like coasts and river floodplains. Vulnerability is especially high where building codes are insufficient for reducing damage from extreme events.
Climate change is also playing a role in the increasing frequency of some types of extreme weather that lead to billion-dollar disasters—most notably the rise in vulnerability to drought, lengthening wildfire seasons in the Western states, and the potential for extremely heavy rainfall becoming more common in the eastern states. Each of these changes in extremes are becoming more visible in relation to the influence of climate change (NCA 2018, Chapter 2).
The geography of billion-dollar disaster events by type
The U.S. is weather and climate conscious for good reason, as each geographic region faces a unique combination of recurring hazards. In fact, billion-dollar disaster events have touched every U.S. state. The maps below reflect the frequency with which each state has been part of a billion-dollar disaster event (i.e., the totals do not mean that each state alone suffered $1 billion in losses for each event).
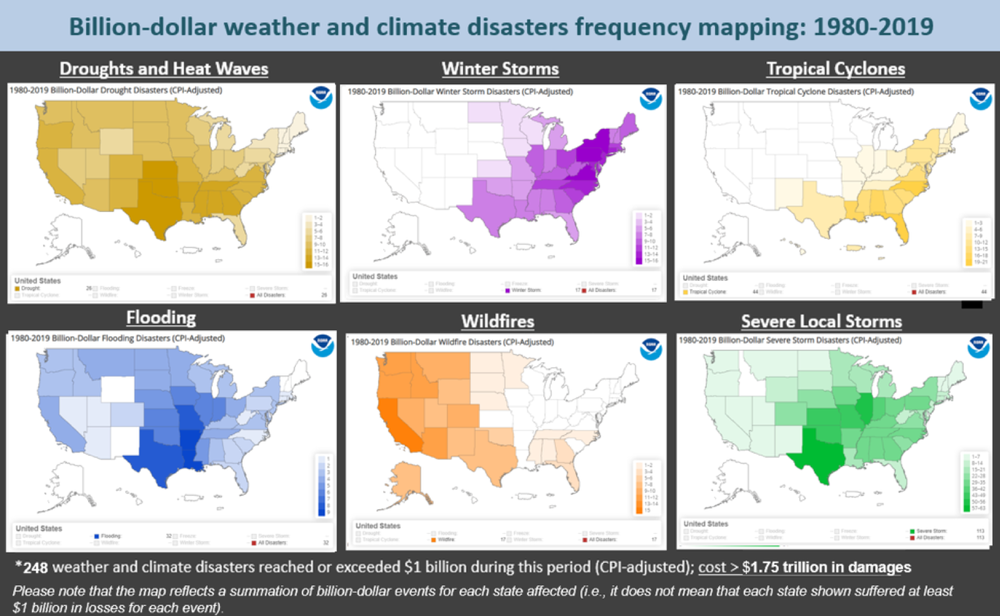
Each disaster type has a distinct footprint of impact over time. We see wildfire impacts largely west of the Plains states, with a few Southeast impacts. However, the most intense and destructive wildfires occur in California–most notably after the year 2000.
There is also a high frequency of inland flooding events that occur in states adjacent to large rivers or the Gulf of Mexico, which is a warm source of moisture to fuel rainstorms. Drought impacts are mostly focused in the Southern and Plains states where there are billions of dollars in agriculture and livestock assets. Crop freeze events have become more sporadic since the early 1990s, but these events can still cause considerable damage in the fruit-producing states of California, Florida, and other southeastern states such as Georgia and South Carolina.
Severe local storm events are common in the Plains and into the Ohio River Valley states. Winter storm impacts are concentrated in the Northeast given the population density and more assets exposed to powerful Nor’easters bringing wind, snow, icing and storm surge. Tropical cyclones are the most costly disaster we assess that create impacts from Texas to New England, but also include many inland states, often as a result of extreme rainfall and inland flood damage.
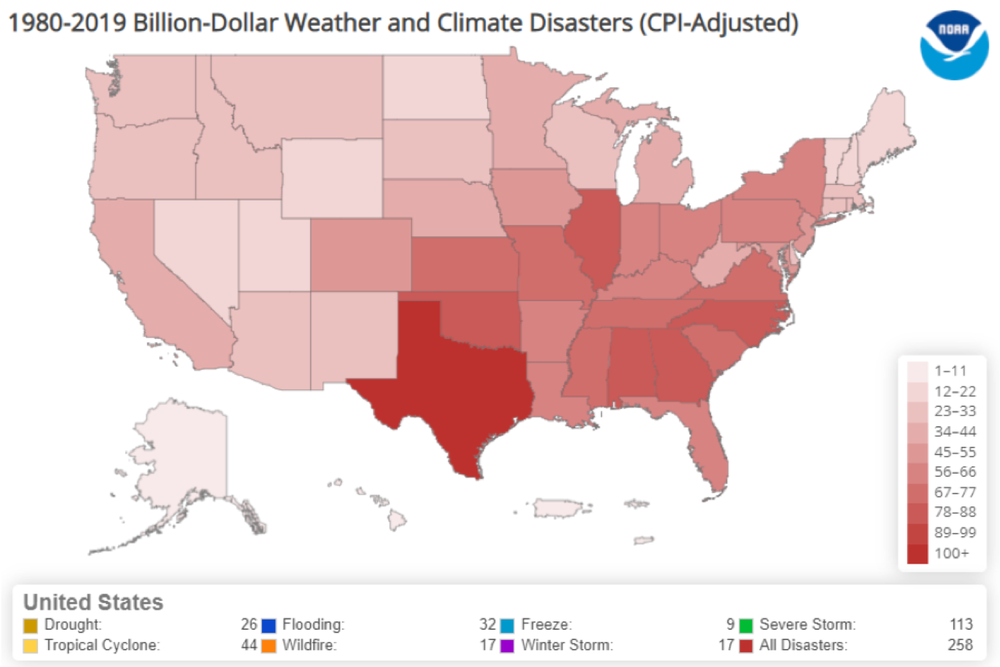
This map depicts the number of times each state was part of a billion-dollar weather or climate disaster since 1980, regardless of hazard type. Note that each disaster did not necessarily cause one billion dollars in damages in an individual state to be included in this total. Screenshot from NOAA NCEI Billion-dollar Disasters webpage.
In total, from 1980–2019, the U.S. South/Central and Southeast regions experienced a higher frequency of billion-dollar disaster events than any other regions, as shown in the red total disaster frequency map. The South has also suffered the highest cumulative damage costs, reflecting the diversity, frequency, and severity of weather and climate events impacting the region.
Each state has been affected by at least 1 billion-dollar disaster since 1980. Texas has experienced the highest number of events (111) and is one of the few states that have been impacted by all seven types of the billion-dollar disasters we analyze.
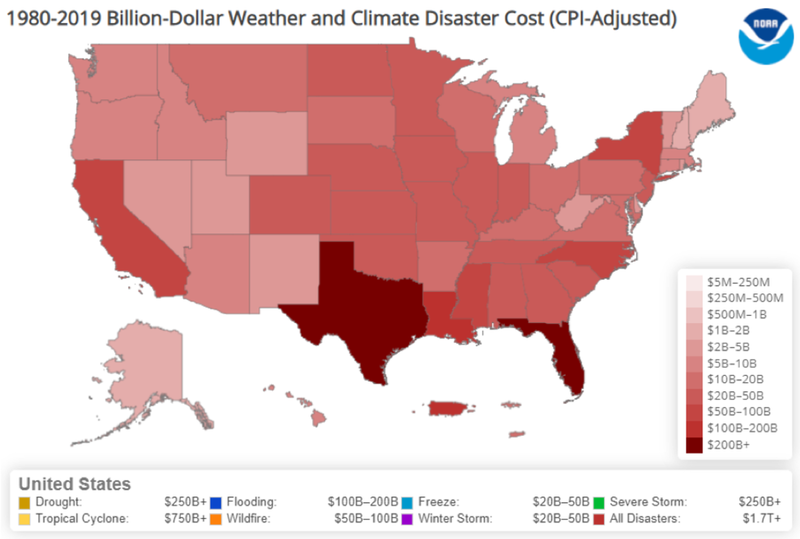
Adjusted for inflation, the South/Central and Southeast regions of the U.S., including the Caribbean U.S. territories, have suffered the highest cumulative damage costs, reflecting the severity and widespread vulnerability of those regions to a variety of weather and climate events. In addition to the highest number of billion-dollar disasters experienced, Texas also leads the U.S. in total cumulative costs (~$250 billion) from billion-dollar disasters since 1980. Florida is the second-leading state in total costs since 1980 (~$225 billion), largely the result of destructive hurricane impacts.
All of the tables and maps shown in this article are screenshots from NCEI’s interactive Billion-dollar Disasters webpage. Visit the page to create your own summaries or download source data. In 2020, NCEI will continue to incorporate new layers and filters that offer added flexibility to the online tools for additional context and analysis. For additional context on data sources, methods, metrics and caveats see: Calculating the Cost of Weather and Climate Disasters.
This article was adapted from “2010-2019: A landmark decade of U.S. billion-dollar weather and climate disasters”, by Adam B. Smith, published on January 8, 2020 on Climate.gov.