CMORPH: Drought Indices
National Oceanic and Atmospheric Administration's (NOAA) Climate Prediction Center (CPC)
The NOAA CMORPH precipitation dataset is a gridded dataset derived from combining numerous microwave-based estimates from low orbiter satellites. The dataset is also archived and managed through the NOAA Climate Data Record program at NOAA's National Centers for Environmental Information (NCEI).
SPI
The Standardized Precipitation Index, or SPI, is a drought index that captures how observed precipitation deviates from the climatological average over a given time period. This global SPI is derived from the NOAA CMORPH dataset, using the Climate Engine tool, and includes timescales of 1, 2, 3, 6, 9 and 12 months.
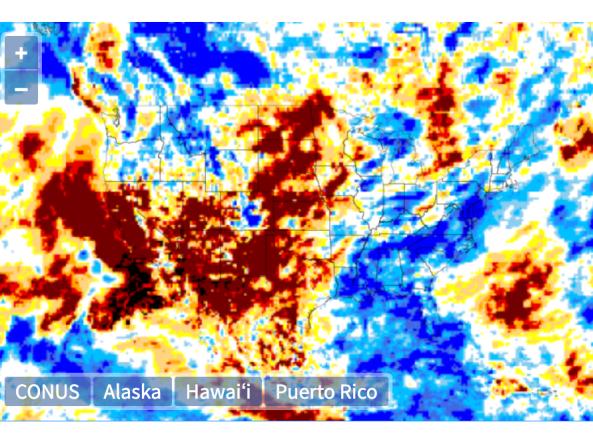
This map shows a global 1-month Standardized Precipitation Index (SPI) from CMORPH.
CMORPH (CPC MORPHing technique) produces global precipitation analyses at very high spatial and temporal resolution. This technique uses precipitation estimates that have been derived from low orbiter satellite microwave observations and interpolated in space and time from geostationary satellite IR data. CMORPH data has a low latency, but does not detect snow effectively and should not be used in areas with snow during the time period selected, in this case the last month.
Dry Conditions
D4 - Exceptional Drought (SPI of -2.0 or less)
The Standardized Precipitation Index (SPI) value for this location is -2.0 or less. SPI values can be interpreted as the number of standard deviations by which the precipitation anomaly deviates from the long-term mean. An SPI of -2.0 or less indicates Exceptional Drought (D4) conditions.
D3 - Extreme Drought (SPI of -1.9 to -1.6)
The Standardized Precipitation Index (SPI) value for this location is between -1.9 to -1.6. SPI values can be interpreted as the number of standard deviations by which the precipitation anomaly deviates from the long-term mean. An SPI of -1.9 to -1.6 indicates Extreme Drought (D3) conditions.
D2 - Severe Drought (SPI of -1.5 to -1.3)
The Standardized Precipitation Index (SPI) value for this location is between -1.5 to -1.3. SPI values can be interpreted as the number of standard deviations by which the precipitation anomaly deviates from the long-term mean. An SPI of -1.5 to -1.3 indicates Severe Drought (D2) conditions.
D1 - Moderate Drought (-1.2 to -0.8)
The Standardized Precipitation Index (SPI) value for this location is between -1.2 to -0.8. SPI values can be interpreted as the number of standard deviations by which the precipitation anomaly deviates from the long-term mean. An SPI of -1.2 to -0.8 indicates Moderate Drought (D1) conditions.
D0 - Abnormally Dry (SPI of -0.7 to -0.5)
The Standardized Precipitation Index (SPI) value for this location is between -0.7 to -0.5. SPI values can be interpreted as the number of standard deviations by which the precipitation anomaly deviates from the long-term mean. An SPI of -0.7 to -0.5 indicates Abnormally Dry (D0) conditions.
Wet Conditions
W0 (0.5 to 0.7)
The Standardized Precipitation Index (SPI) value for this location is between 0.5 to 0.7, indicating abnormally wet (W0) conditions.
W1 (0.8 to 1.2)
The Standardized Precipitation Index (SPI) value for this location is between 0.8 to 1.2, indicating moderate wet (W1) conditions.
W2 (1.3 to 1.5)
The Standardized Precipitation Index (SPI) value for this location is between 1.3 to 1.5, indicating severe wet (W2) conditions.
W3 (1.6 to 1.9)
The Standardized Precipitation Index (SPI) value for this location is between 1.6 to 1.9, indicating extreme wet (W3) conditions.
W4 (2.0 or more)
The Standardized Precipitation Index (SPI) value for this location is 2.0 or greater, indicating exceptional wet (W4) conditions.
This map shows a global 1-month Standardized Precipitation Index (SPI) from CMORPH.
CMORPH (CPC MORPHing technique) produces global precipitation analyses at very high spatial and temporal resolution. This technique uses precipitation estimates that have been derived from low orbiter satellite microwave observations and interpolated in space and time from geostationary satellite IR data. CMORPH data has a low latency, but does not detect snow effectively and should not be used in areas with snow during the time period selected, in this case the last month.
The global CMORPH 1-month SPI is updated daily with a delay of 2–3 days
HOW TO
How to use this site:
- Datasets are in GeoTIFF, readable by GIS software and many meteorological tools.
ACCESS
Data processed via Climate Engine available for download from NOAA/NIDIS
Related Publications
Joyce, R. J., J. E. Janowiak, P. A. Arkin, and P. Xie, 2004: CMORPH: A method that produces global precipitation estimates from passive microwave and infrared data at high spatial and temporal resolution.. J. Hydromet., 5, 487-503. https://ftp.cpc.ncep.noaa.gov/precip.orig/CMORPH_V1.0/REF/Joyce_et_al_2004_JHM_CMORPHP.pdf
Guttman, N. B., 1999: Accepting the standardized precipitation index: A calculation algorithm. J. Amer. Water Resour. Assoc., 35, 311–322, https://doi.org/10.1111/j.1752-1688.1999.tb03592.x.
Wu, H., M. J. Hayes, D. A. Wilhite, and M. D. Svoboda, 2005: The effect of length of record on the standardized precipitation index. Int. J. Climatol., 25, 505–520, https://doi.org/10.1002/joc.1142.
Wu, H., M. D. Svoboda, M. J. Hayes, D. A. Wilhite, and F. Wen, 2007: Appropriate application of the standardized precipitation index in arid locations and dry seasons. Int. J. Climatol., 27, 65–79, https://doi.org/10.1002/joc.1371.
Cumbie-Ward, R. V., and R. P. Boyles, 2016: Evaluation of a high-resolution SPI for monitoring local drought severity. J. Appl. Meteor. Climatol., 55, 2247–2262, https://doi.org/10.1175/JAMC-D-16-0106.1.
Vose, R. S., and et al, 2014a: NOAA’s Gridded Climate Divisional Dataset (CLIMDIV). NOAA National Climatic Data Center, accessed 4 June 2018, https://doi.org/10.7289/V5M32STR.

