Climate Prediction Center
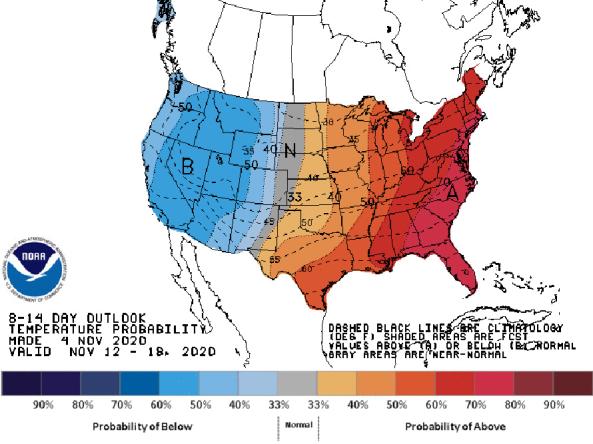
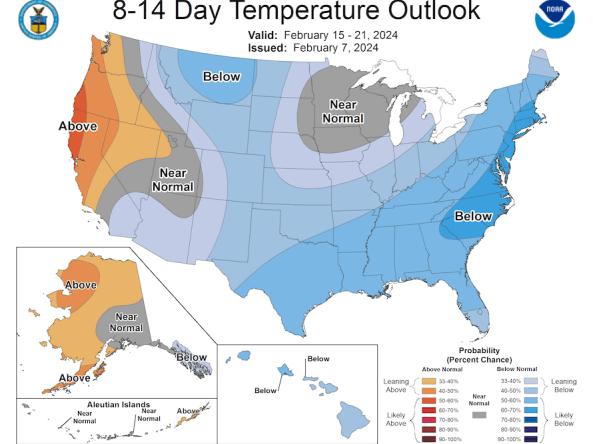
National Weather Service (NWS) Climate Prediction Center (CPC) generates outlooks that view probabilities of above- or below-normal temperature and precipitation maps at the 6-10 Day, 8-14 Day, Wee
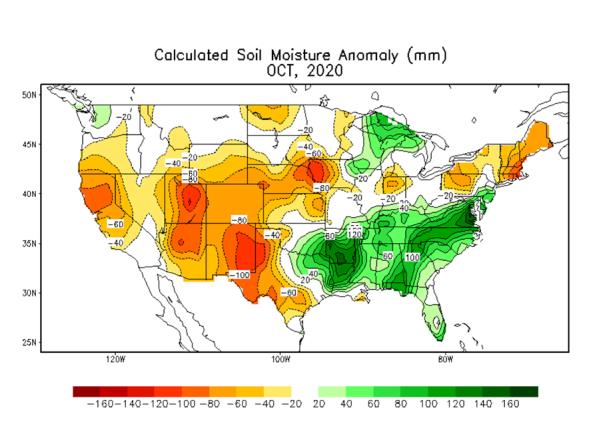
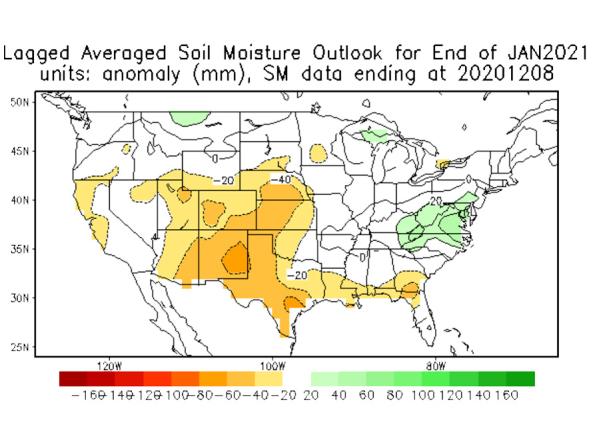
Soil moisture conditions at the daily and monthly scales depicting total soil moisture, percentiles and anomalies, as well as monthly and seasonal change.
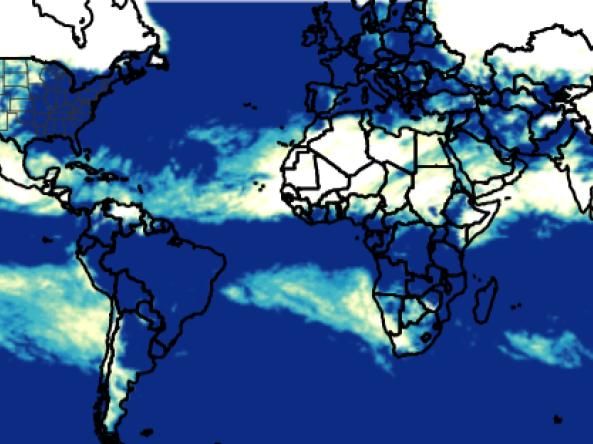
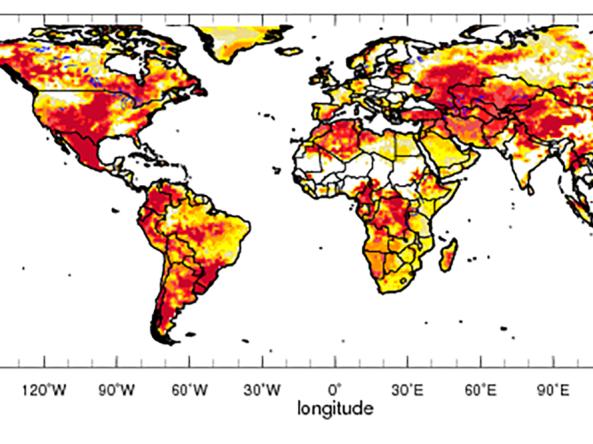
The Global Gridded Standardized Precipitation Index (SPI) is derived from the CMORPH daily dataset and includes timescales of 1, 3, 6 and 9 months. The NOAA CMORPH precipitatio
The Global Gridded Standardized Precipitation Index (SPI) is derived from the CMORPH daily dataset and includes timescales of 1, 3, 6 and 9 months. The NOAA CMORPH precipitatio
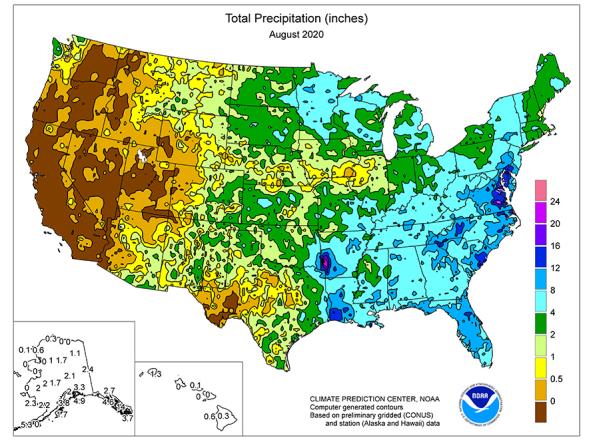
Regional weekly, one-, three-, and twelve-month maps depicting total precipitation, percent of normal precipitation, average temperature, maximum and minimum temperatures, and departures from norma
The National Weather Service (NWS) Climate Prediction Center (CPC) produces monthly and seasonal drought outlooks based on Soil Moisture (CAS).
The Climate Prediction Center (CPC) produces temperature and precipitation outlooks for the U.S., including 6-10 day, 8-14 day, monthly, and seasonal outlooks.
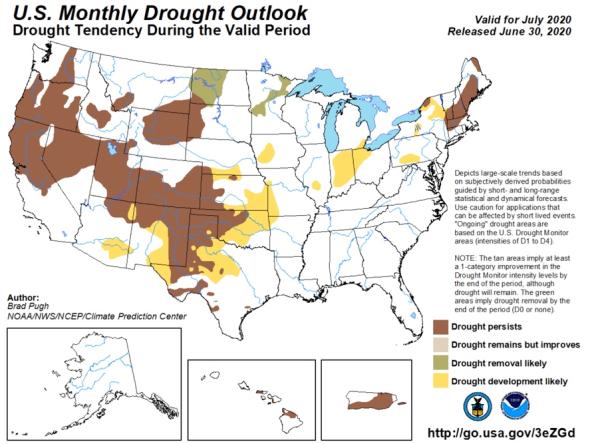
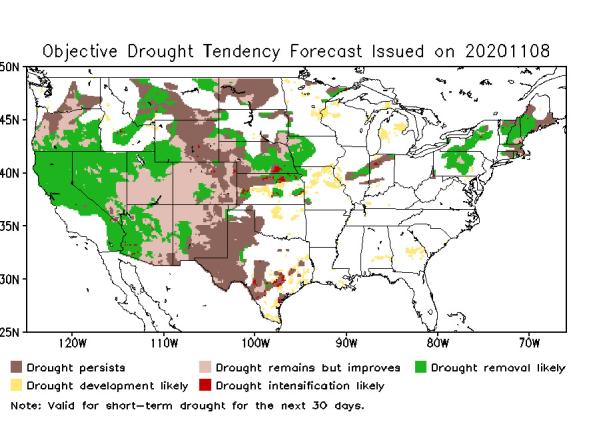
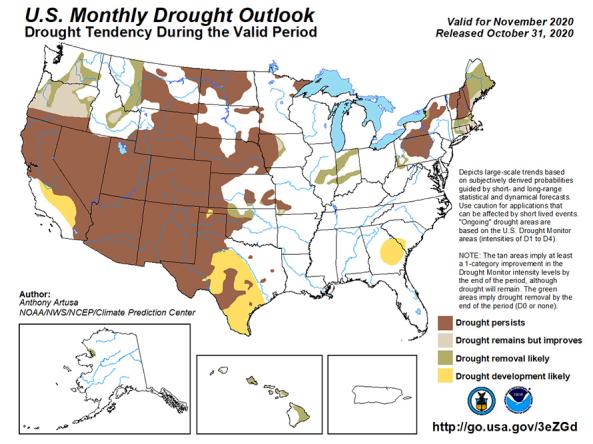
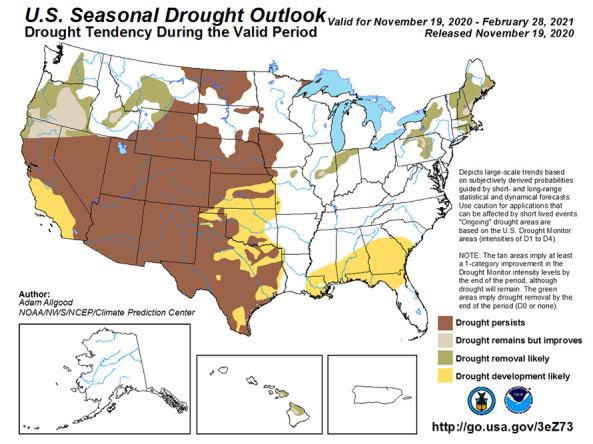
The monthly and seasonal (3-month) outlook for drought tendency from the Climate Prediction Center (CPC), which depicts large-scale trends based on subjectively derived probabilities guided by shor
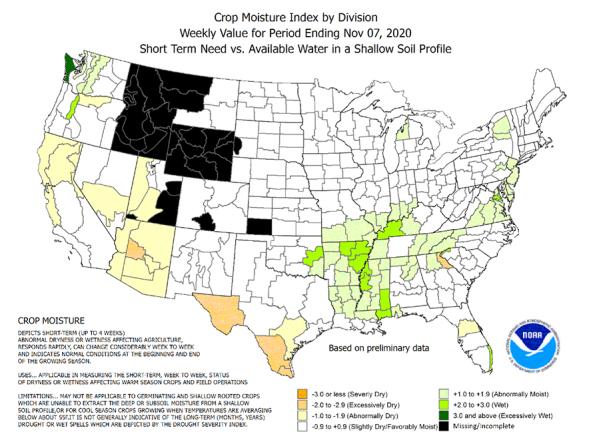
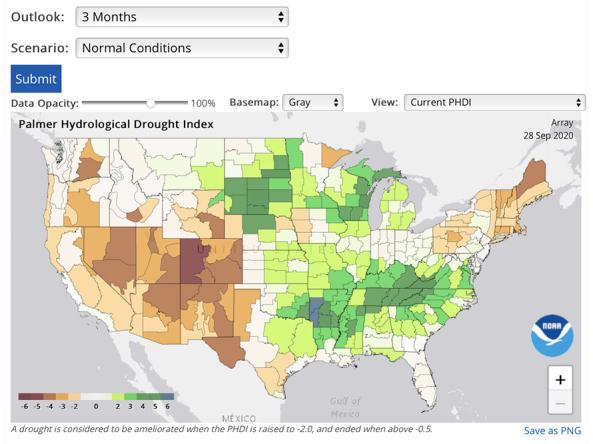
The CMI is an index of the relative dryness or wetness affecting water sensitive economies. It provides the short-term or current status of purely agricultural drought or moisture surplus.
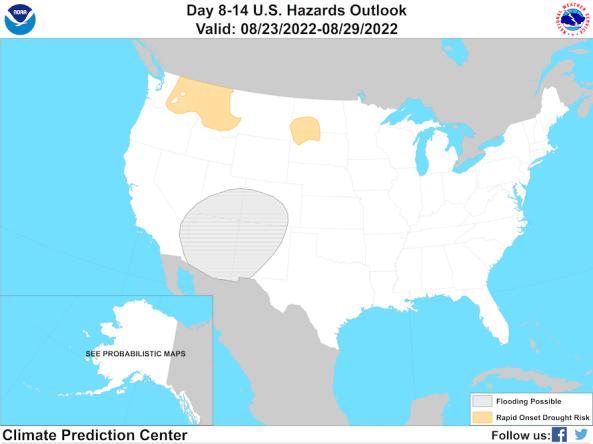
The Climate Prediction Center's Day 8–14 (Week 2) U.S. Hazards Outlook shows potential hazardous conditions related to temperature, precipitation, wind, snow, and rapid onset drought.
A soil moisture tool for the next 2 weeks based on the National Weather Service (NWS) Global Forecast System (GFS) model.
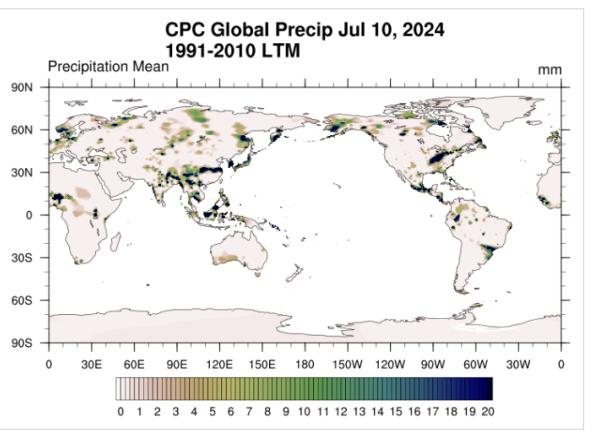
The National Weather Service's Climate Prediction Center (CPC) produces a Global Unified Daily Precipitation product from 1979-present.
The Global Gridded Standardized Precipitation Index (SPI) is derived from the CMORPH daily dataset and includes timescales of 1, 3, 6 and 9 months. The NOAA CMORPH precipitatio
Global drought prediction and analysis tools produced by IRI in collaboration with NOAA CPC, and the University of Maine.
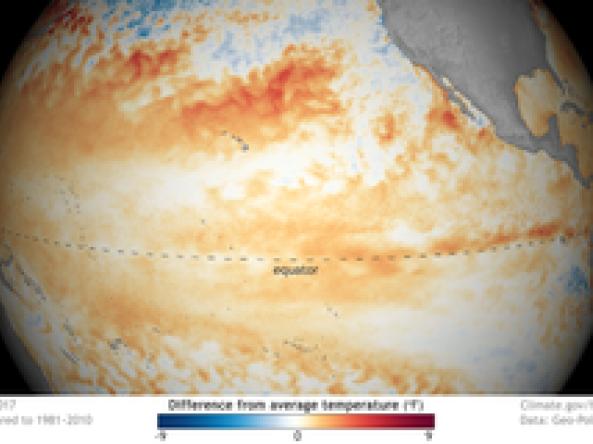
The NOAA Climate Prediction Center's El Niño-Southern Oscillation (ENSO) Diagnostic Discussion provides a synopsis of current ENSO conditions and outlooks for the coming seasons.
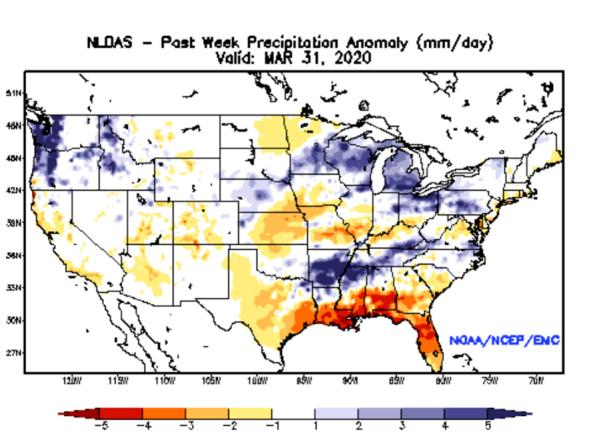
NLDAS Drought Monitor Products: an experimental drought monitor derived from near real-time soil moisture output from both the NASA MOSAIC and NCEP Noah land surface models.
An integrated product that combines information from the flash drought development tool and subseasonal SPI 3-month forecasts. The product is produced daily and is based on the most rece
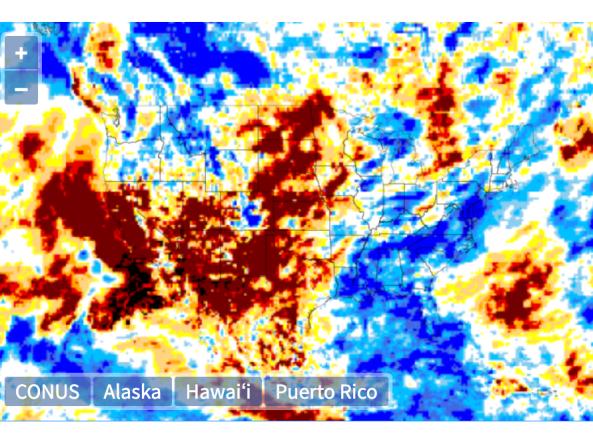
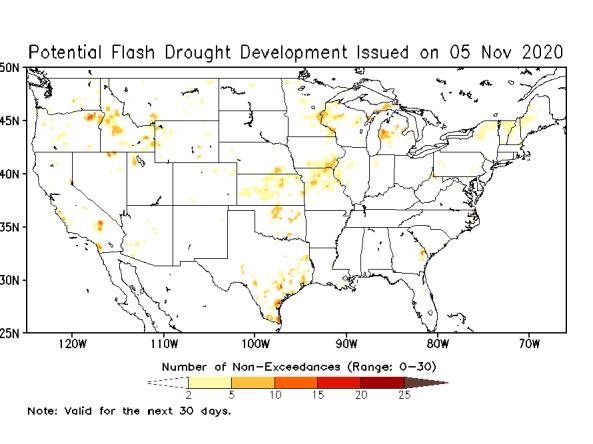
The Potential Flash Drought Detection Tool identifies areas of potential rapid drought emergence by identifying rapid change of evapotranspiration using the NLDAS-2 land surface model.
The National Weather Service's Climate Prediction Center (CPC) produces official monthly and seasonal temperature and precipitation outlook products.
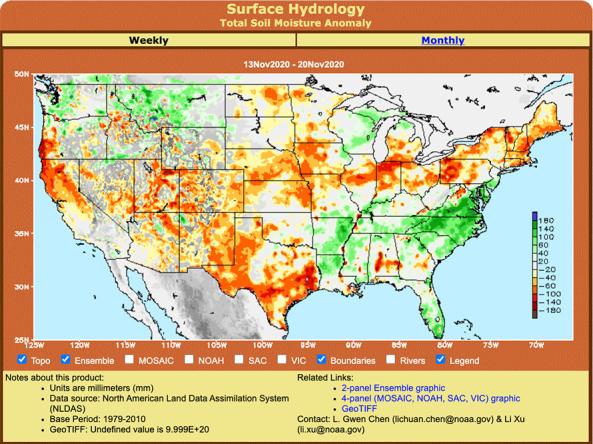
Weekly and monthly hydrological data from the North-American Land Data Assimilation System (NLDAS).
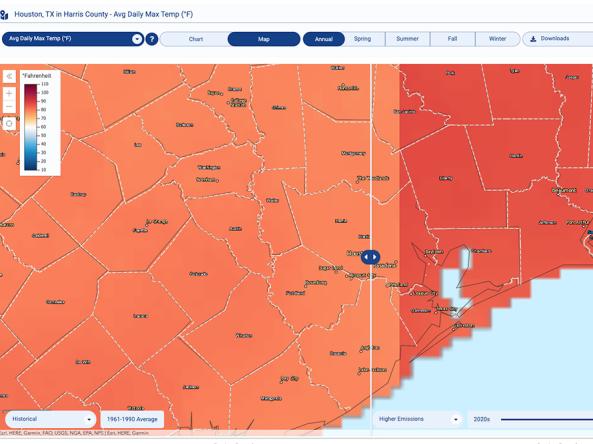
The Climate Explorer offers graphs and maps of observed and projected temperature, precipitation, and related climate variables for every county in the contiguous United States, helping people asse
The U.S. Monthly Drought Outlook predicts whether drought will emerge, stay the same or get better over the next 30 days or so.
The U.S. Seasonal Drought Outlook depicts large-scale trends based on subjectively derived probabilities guided by short- and long-range statistical and dynamical forecasts.
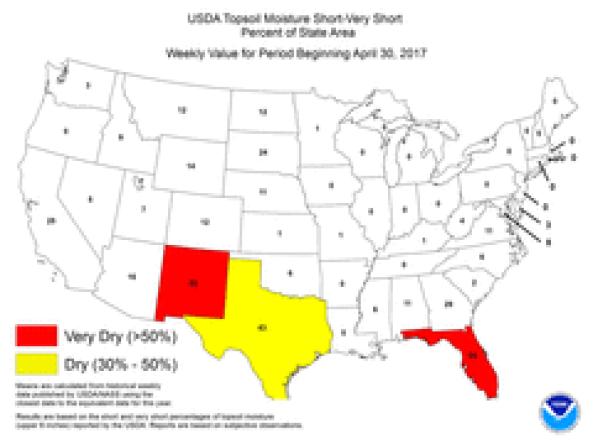
The National Weather Service Climate Prediction Center produces Topsoil Moisture Monitoring maps based on United States Department of Agriculture (USDA) state reports of topsoil moisture condi


