Crop Condition and Soil Moisture Analytics Tool (Crop-CASMA)
U.S. Department of Agriculture (USDA) National Agricultural Statistics Service, George Mason University, National Aeronautics and Space Administration (NASA)
Crop-CASMA (Crop Condition and Soil Moisture Analytics) is a web-based geospatial application developed by the USDA's National Agricultural Statistics Service, in collaboration with George Mason University and NASA. Crop-CASMA provides access to high-resolution data from NASA SMAP (Soil Moisture Active Passive) and MODIS (Moderate Resolution Imaging Spectroradiometer) missions to map soil moisture and crop vegetation conditions across the United States. The tool is designed to help farmers, researchers, statisticians, and students with spring planting, tracking damage after natural disasters, monitoring crop health, and more. Users can select an area, create a map as a PDF, and also download data to input into their own models.
An accurate depiction of soil moisture conditions can provide valuable insights for agricultural monitoring, weather prediction, and drought and flood early warning.
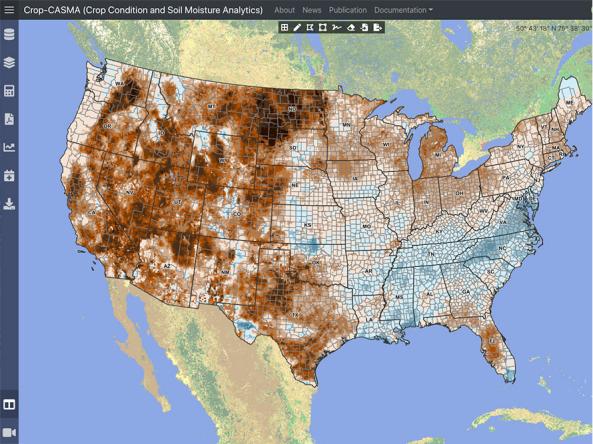
This map shows the moisture content of the top 1 meter of soil, according to NASA's Crop Condition and Soil Moisture Analytics tool (Crop-CASMA). It relies on remotely sensed soil moisture data derived from NASA missions.
Soil moisture is shown as a deviation from average soil moisture conditions from 2015–present. Brown hues indicate below-average soil moisture, and blue hues indicate above-average soil moisture.
Soil moisture plays an important role in drought and flood forecasting, agricultural monitoring, forest fire prediction, water supply management, and other natural resource activities. Soil moisture observations can forewarn of impending drought or flood conditions before other more standard indicators are triggered.
Learn MoreSoil Moisture Anomaly
An accurate depiction of soil moisture conditions can provide valuable insights for agricultural monitoring, weather prediction, and drought and flood early warning.
This map shows the moisture content of the top 1 meter of soil, according to NASA's Crop Condition and Soil Moisture Analytics tool (Crop-CASMA). It relies on remotely sensed soil moisture data derived from NASA missions.
Soil moisture is shown as a deviation from average soil moisture conditions from 2015–present. Brown hues indicate below-average soil moisture, and blue hues indicate above-average soil moisture.
Data are updated daily, with a 3-day delay.
Soil moisture plays an important role in drought and flood forecasting, agricultural monitoring, forest fire prediction, water supply management, and other natural resource activities. Soil moisture observations can forewarn of impending drought or flood conditions before other more standard indicators are triggered.
Learn More


