Evaporative Stress Index (ESI)
National Aeronautics and Space Atmospheric Administration (NASA), United States Department of Agriculture (USDA)
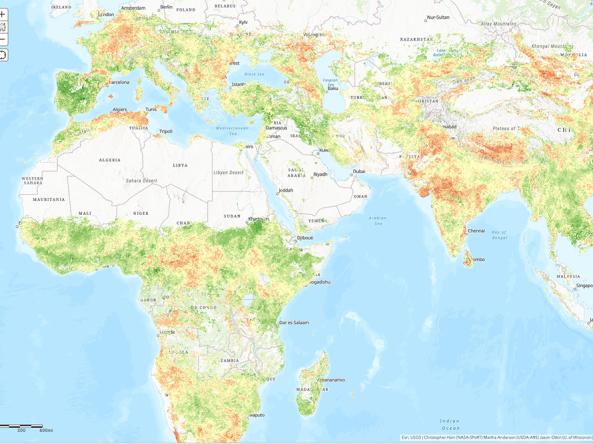
The Evaporative Stress Index (ESI) describes temporal anomalies in evapotranspiration (ET), highlighting areas with anomalously high or low rates of water use across the land surface. Here, ET is retrieved via energy balance using remotely sensed land-surface temperature (LST) time-change signals. LST is a fast-response variable, providing proxy information regarding rapidly evolving surface soil moisture and crop stress conditions at relatively high spatial resolution. The ESI also demonstrates capability for capturing early signals of “flash drought," brought on by extended periods of hot, dry, and windy conditions leading to rapid soil moisture depletion.
The Evaporative Stress Index (ESI) describes temporal anomalies in evapotranspiration (ET), highlighting areas with anomalously high or low rates of water use across the land surface. The ESI also demonstrates capability for capturing early signals of "flash drought," brought on by extended periods of hot, dry, and windy conditions leading to rapid soil moisture depletion.
Standardized ET/PET Anomolies
The Evaporative Stress Index (ESI) describes temporal anomalies in evapotranspiration (ET), highlighting areas with anomalously high or low rates of water use across the land surface. The ESI also demonstrates capability for capturing early signals of "flash drought," brought on by extended periods of hot, dry, and windy conditions leading to rapid soil moisture depletion.
How to
How to use this site:
- To analyze ESI data, go to http://ClimateSERV.servirglobal.net, choose Get Started, draw a polygon or choose a feature on the map, and then select Evaporative Stress Index (ESI) as your Data Source.
- Download ESI data as tif files
- To visualize Evaporative Stress Index (ESI) data in a web map service, see ArcGIS REST Service: 4-Week ESI, 12-Week ESI
Access
Evaporative Stress Index (ESI): NASA SERVIR data catalog page
Evaporative Stress Index (ESI) maps: Access global ESI data
Documentation
Citations
- Anderson, M. C., J. M. Norman, G. R. Diak, W. P. Kustas, and J. R. Mecikalski, 1997: A two-source time-integrated model for estimating surface fluxes using thermal infrared remote sensing. Remote Sens. Environ., 60, 195-216.
- Anderson, M. C., J. M. Norman, J. R. Mecikalski, J. P. Otkin, and W. P. Kustas, 2007a: A climatological study of evapotranspiration and moisture stress across the continental U.S. based on thermal remote sensing: I. Model formulation. J. Geophys. Res., 112, D10117, doi:10110.11029/12006JD007506.
- Anderson, M. C., J. M. Norman, J. R. Mecikalski, J. P. Otkin, and W. P. Kustas, 2007b: A climatological study of evapotranspiration and moisture stress across the continental U.S. based on thermal remote sensing: II. Surface moisture climatology. J. Geophys. Res., 112, D11112, doi:11110.11029/12006JD007507.
- Anderson, M. C., C. R. Hain, B. Wardlow, J. R. Mecikalski, and W. P. Kustas (2011), Evaluation of a drought index based on thermal remote sensing of evapotranspiration over the continental U.S., J. Climate, 24, 2025-2044.
- McKee, T. B., N. J. Doesken, and J. Kleist, 1993: The relationship of drought frequency and duration to time scales. AMS Eighth conf. on Applied Climatology, Anaheim, CA, 179-184.
- McKee, T. B., N. J. Doesken, and J. Kleist, 1995: Drought monitoring with multiple time scales. AMS Ninth conf. on Applied Climatology, Dallas, TX, 233-236.
- Norman, J. M., W. P. Kustas, and K. S. Humes, 1995: A two-source approach for estimating soil and vegetation energy fluxes from observations of directional radiometric surface temperature. Agric. For. Met., 77, 263-293.
- Svoboda, M., and Coauthors, 2002: The Drought Monitor. Bull. Amer. Meteorol. Soc., 83, 1181-1190.