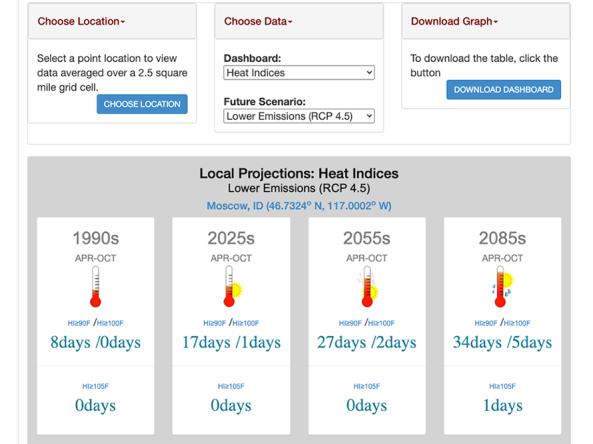
This tool, available as part of The Climate Toolbox, provides a table of future climate projections from an average of 20 global climate models under either high or low future greenhouse gas emissi
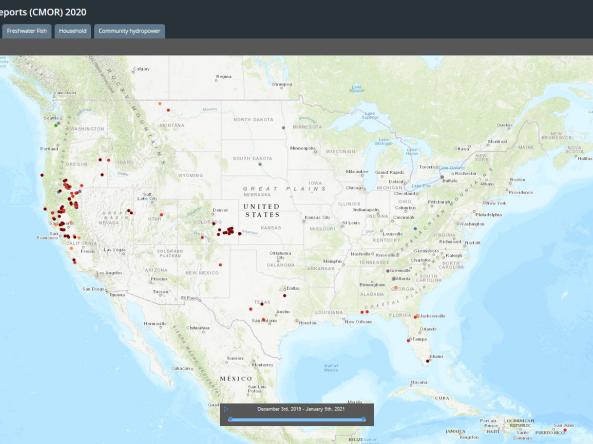
Condition Monitoring Observer Reports on Drought (CMOR-Drought) is a tool that allows citizen scientists to submit obse
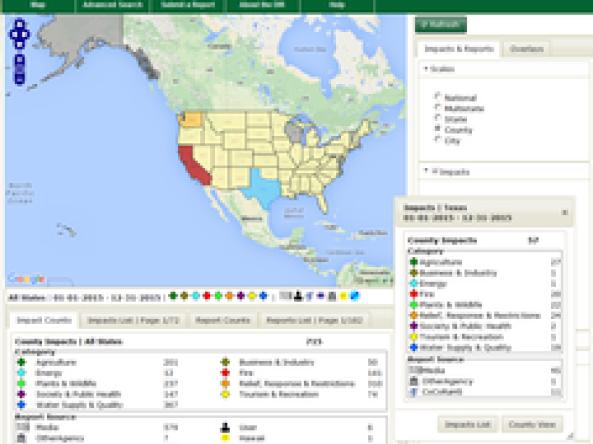
Drought Impacts Reporter (DIR): an interactive database of drought impacts in the U.S., by location, data, type, and cost built from stakeholder, government, media and other reports.
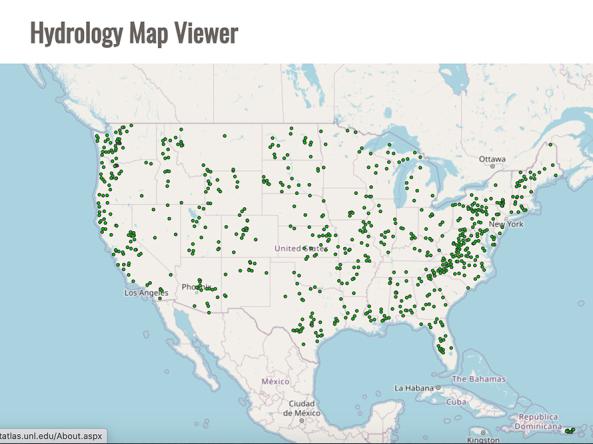
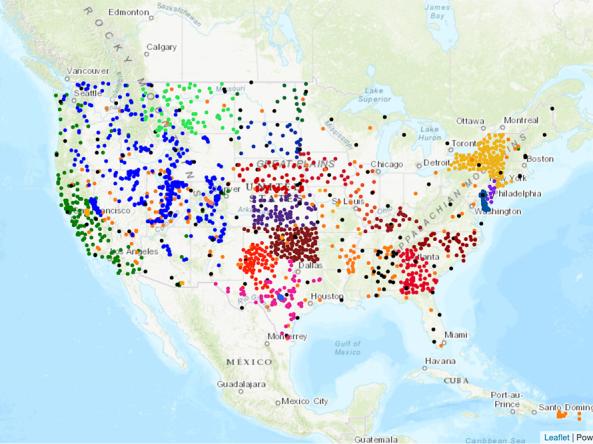
The Drought Risk Atlas provides historic data about drought through 2017 for weather stations across the United States that have at least 40 years of records.
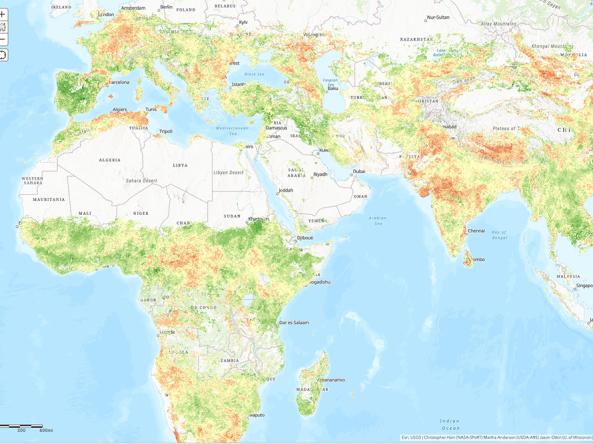
NASA/USDA provides access to Evaporative Stress Index (ESI) data products - a drought index based on remotely sensed evapotranspiration (ET).
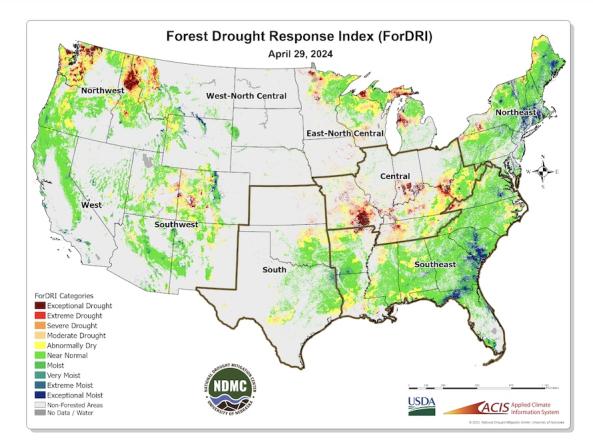
The Forest Drought Response Index (ForDRI) is a new combined indicator tool to identify and characterize forest drought stress.
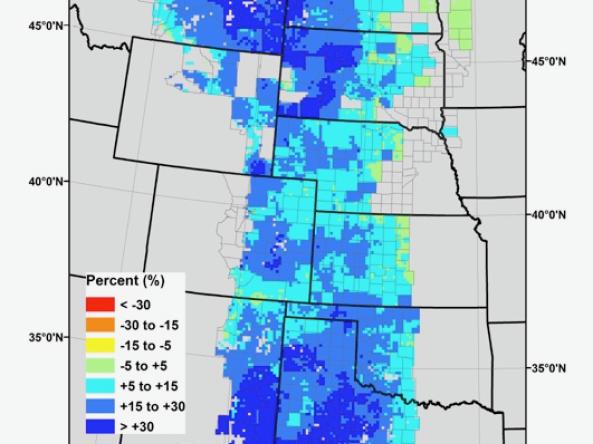
Grass-Cast indicates for ranchers and rangeland managers what productivity is likely to be in the upcoming growing season relative to their own county’s 34-year history.
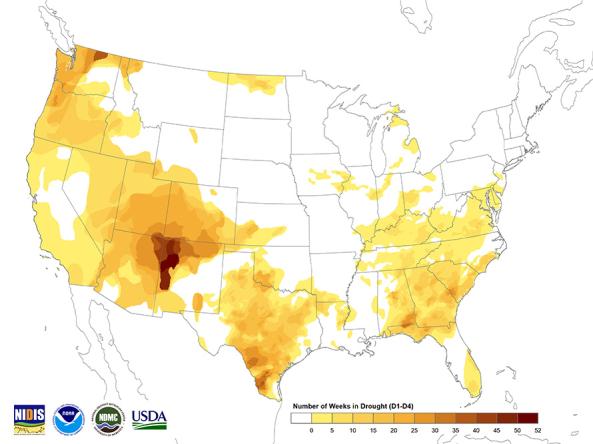
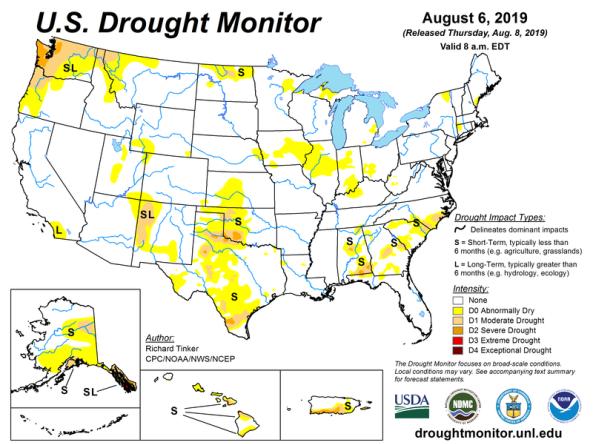
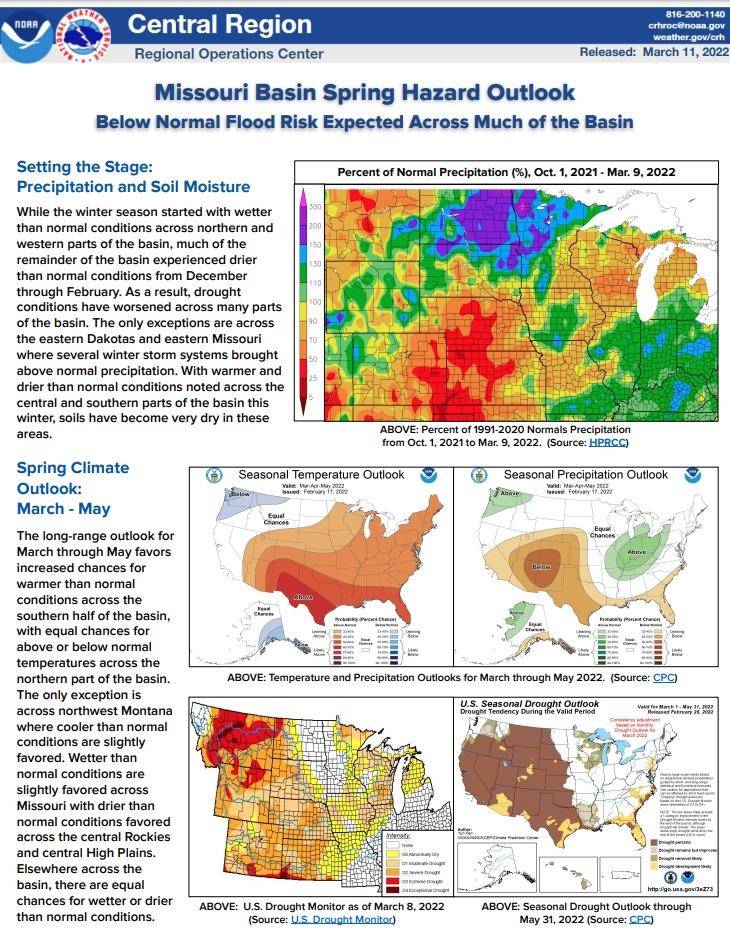
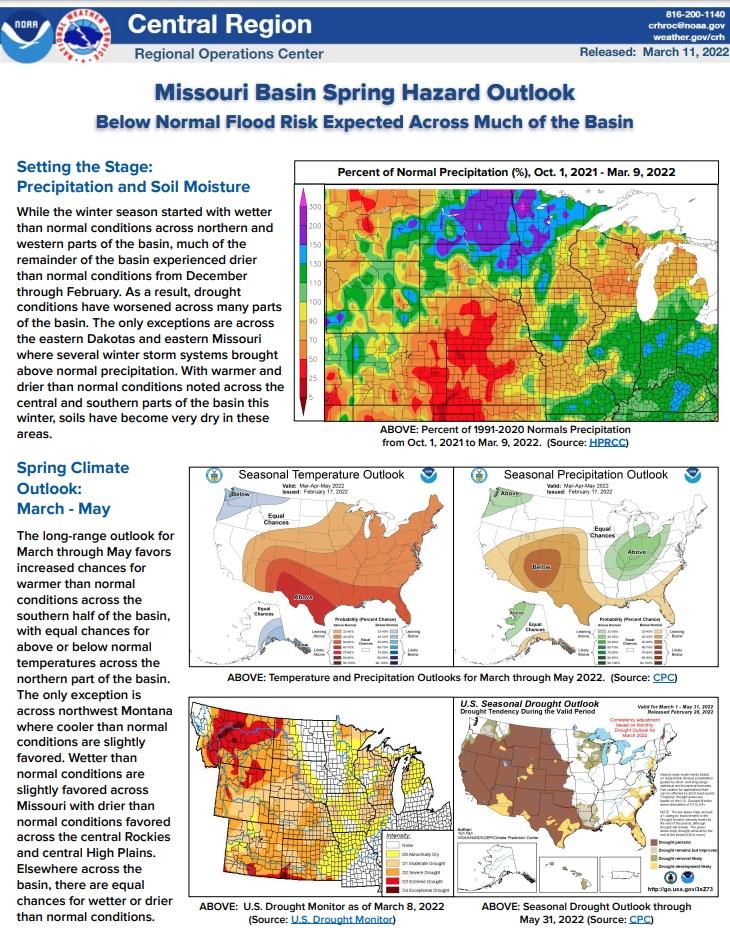
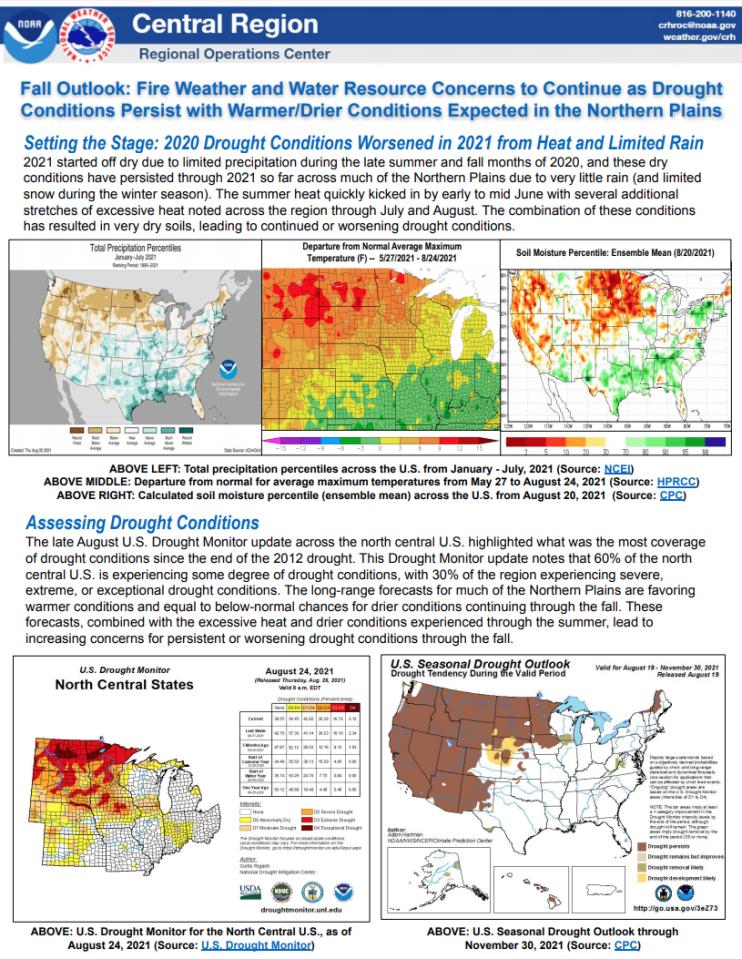
The U.S. Drought Monitor (USDM) is a weekly map, released each Thursday, to show the location and intensity of drought across the country.
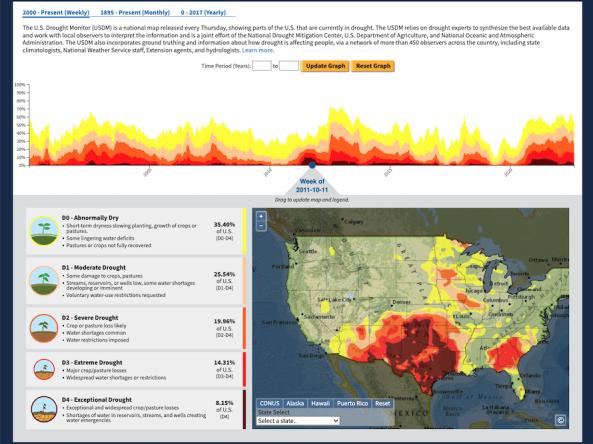
The U.S. Drought Portal's Historical Data & Conditions Tool displays three historical drought datasets side by side on an interactive time series graph and map: U.S.
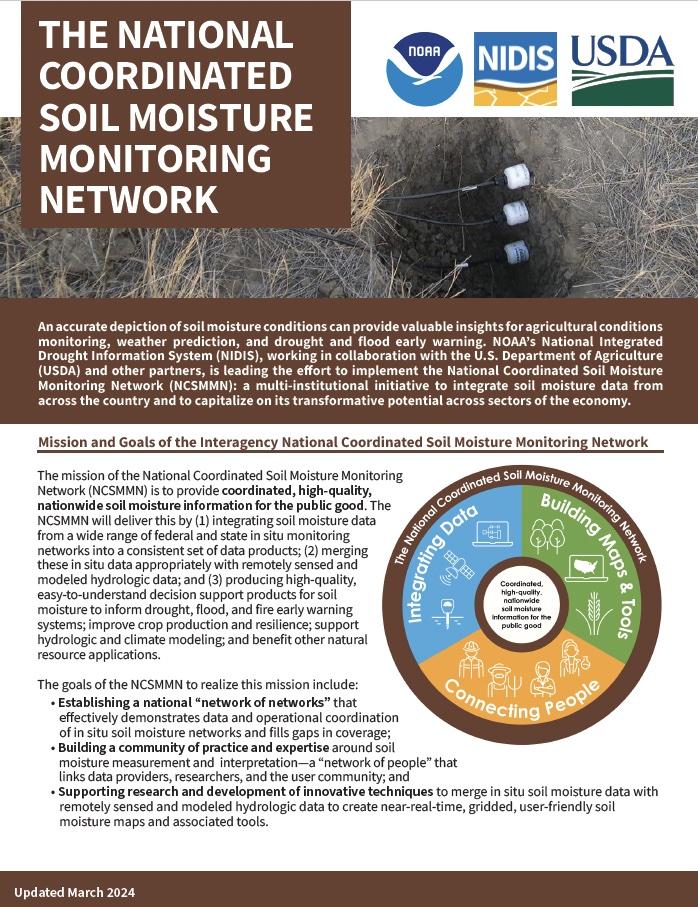
The research-based website NationalSoilMoisture.com provides high-resolution gridded soil moisture products derived from in situ soil moisture measurements, Natural Resources Conserva
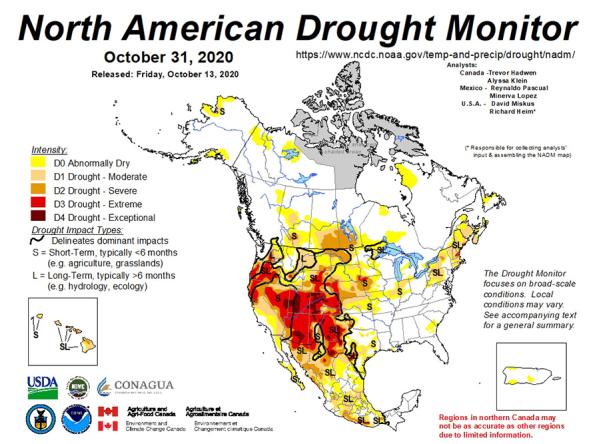
North American Drought Monitor: A collaboration between the U.S., Canada and Mexico to create a monthly continental drought monitor.
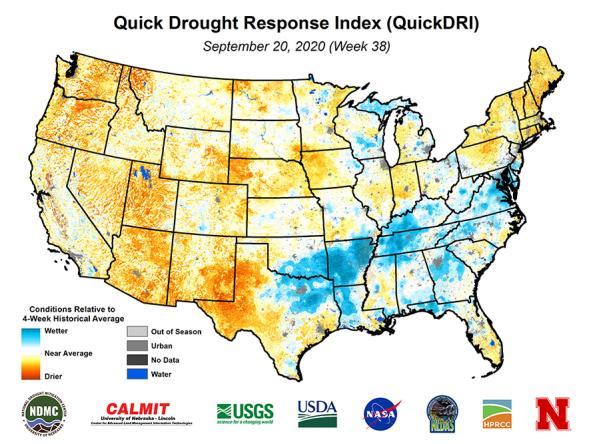
Quick Drought Response Index (QuickDRI): a geospatial tool that characterizes the intensification of short-term drought condition patterns on a weekly basis across the continental United States (CO
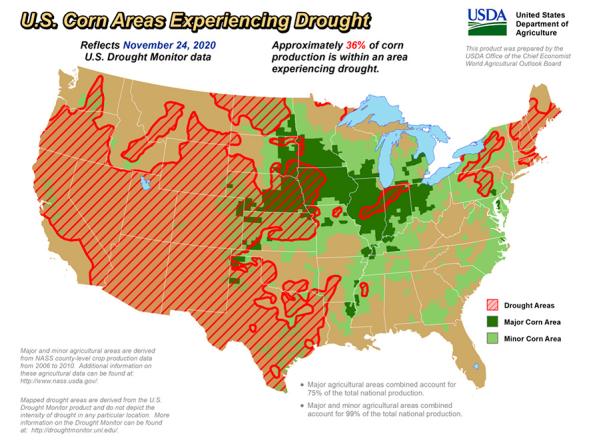
The U.S. Department of Agriculture produces weekly maps and charts displaying locations and percentages of drought-affected areas corn, soybeans, hay, cattle, and winter wheat.
The U.S. Drought Monitor is a map updated each Thursday to show the location and intensity of drought across the country.
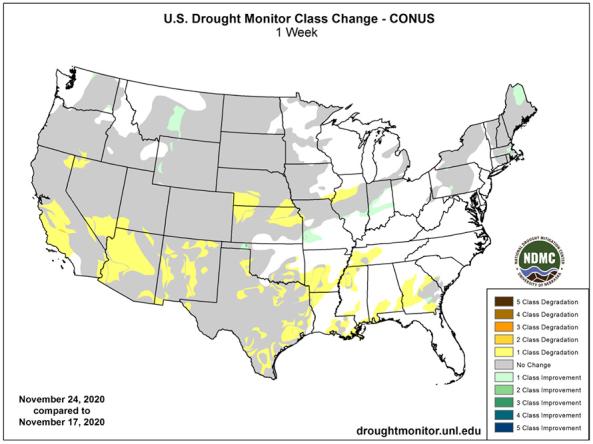
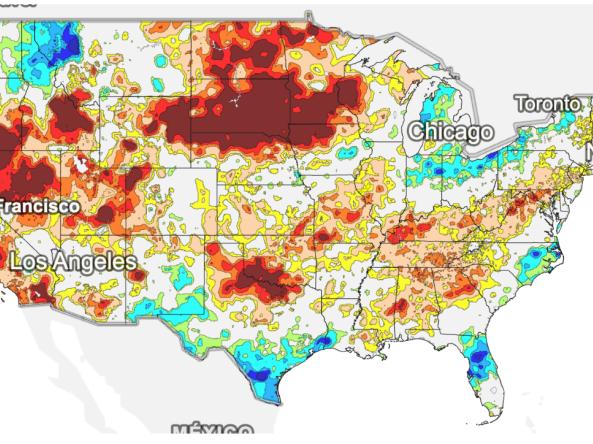
USDM Drought Change Maps display changes in drought class degradation and drought class improvements across the United States.
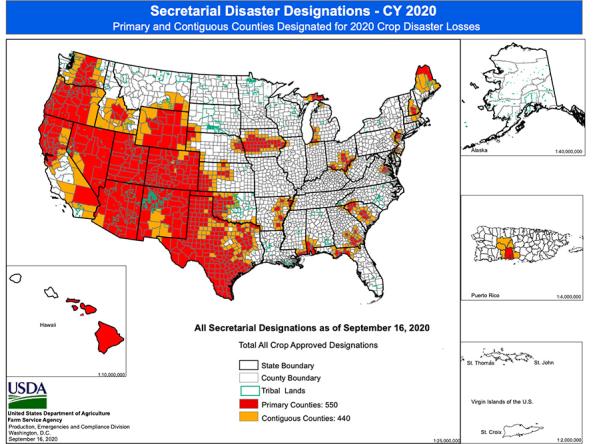
Maps displaying counties declared primary (red) or contiguous (orange) disaster counties by the Secretary of Agriculture.


