Grassland Production Forecast (Grass-Cast)
Colorado State University, U.S. Department of Agriculture, National Drought Mitigation Center, University of Arizona
Grass-Cast indicates for ranchers and rangeland managers what productivity is likely to be in the upcoming growing season relative to their own county’s 36-year history. Grass-Cast uses almost 40 years of historical data on weather and vegetation growth—combined with seasonal precipitation forecasts—to predict if rangelands in individual grid cells (whose size is 10 km x 10km, or ~ 6 miles x 6 miles) are likely to produce above-normal, near-normal, or below-normal amounts of vegetation.
Ranchers and rangeland managers will need to combine the forecast information with their knowledge of local soils, plant communities, topography, and other conditions as part of their decision-making process.
How to
How to use the maps:
- Select "Grass-Cast Maps" from the left menu bar.
- Toggle between the two tabs—Static and Zoomable—to view static image maps or interactive zoomable maps, respectively.
- Within each tab, select the area whose forecast you wish to view: Great Plains or Southwest.
- This will show three map scenarios, showing grassland production forecasts if precipitation is (1) above (2) near, or (3) below normal.
- View the CPC monthly and seasonal precipitation forecasts to determine which forecast map is most likely for your region.
For more information: Go to the Grass-Cast home page and select "How to Read the Maps" from the left menu bar to view videos and transcripts on how to read and interpret the Grass-Cast maps.
Access
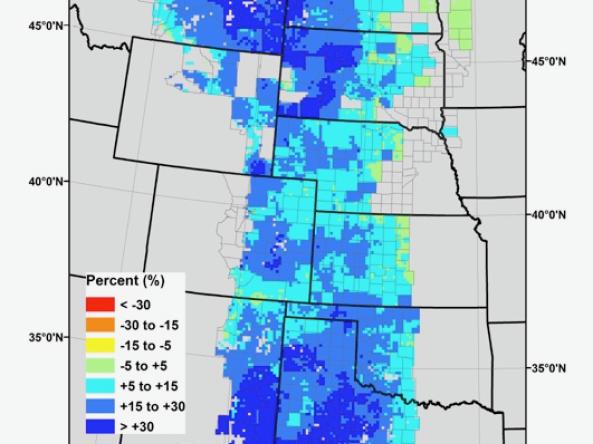
Grass-Cast Outlooks: Static and zoomable maps depicting the percent change in grassland production for your region compared to its 36-year average.