IRI Global Drought Analysis and Prediction Tools
Columbia University International Research Institute for Climate and Society (IRI), NOAA/National Weather Service/National Centers for Environmental Prediction/Climate Prediction Center (CPC), University of Maine
The International Research Institute (IRI) has worked in collaboration with the NOAA Climate Prediction Center (CPC) and the University of Maine to develop a tool that provides probabilistic forecasts of future Standardized Precipitation Index (SPI) as an indicator of drought for various accumulation periods for the globe. In addition to the SPI forecast tool, analyses of observed precipitation conditions using monthly SPI are provided, based upon monthly totals from the CPC's Gauge - OLR Blended (GOB) daily gridded precipitation analysis.
Global Drought Analysis Tool: This map shows values of the monthly Standardized Precipitation Index (SPI) for a user-selected accumulation period (3, 6, 9, or 12-month) for the globe, based upon observed monthly precipitation totals from the Climate Prediction Center's (CPC) Gauge - OLR Blended (GOB) daily precipitation analysis (combined retrospective and real-time, accumulated to monthly).
Global Drought Prediction Tool – NMME Multi-Model Ensemble SPI Forecast: This tool displays maps of probabilistic forecasts of the Standardized Precipitation Index (SPI, for 3, 6, 9, or 12-month accumulation periods) for the globe based on monthly precipitation predictions from 6 NMME models and the initial observed condition.
How to
How to use this site:
- Global Drought Analysis Tool – users can click on a location on the map to generate a time series graph of the selected SPI index over the past ten years for that location, and a time series graph that overlays a plot of the SPI over the past calendar year with plots of SPI for the three previous calendar years at that location. Click and drag on the map to zoom in. To select which administrative boundaries to display on the map (including U.S. states), mouse over the map and select the "Layers" icon. Then use the check boxes that appear to select the corresponding administrative boundaries.
- Additional Instructions: for Global Drought Analysis Tool
- Global Drought Prediction Tool – The forecast “Start Time” denotes the end of the latest full month of observations available to make the forecast. use the “Map Type” menu to display either the forecast “Probability” of a user-selected “SPI Threshold” value or the “SPI Value” associated with a user-specified “Probability of Non-Exceedance.” Users can also select a desired “Lead Time” for the forecast.
- Additional Instructions: for Global Drought Prediction Tool
Access
Global Drought Analysis Page: homepage to International Research Institute (IRI) Global Drought Products
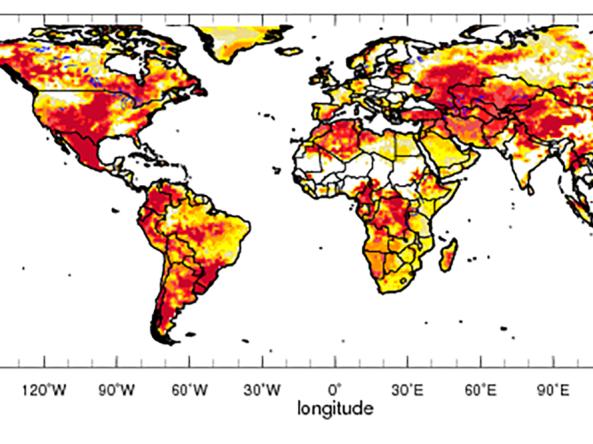
Global Drought Analysis Tool: Global SPI (3, 6, 9, or 12-month) maps provide an indication of short-term to longer-term wet (green, positive SPI) or dry (yellow to red, negative SPI) conditions based upon precipitation alone. The negative half of the color scale uses the same colors and thresholds of SPI corresponding to the percentiles associated with the D0 (30%tile) to D4 (2%tile) drought intensity categories used in the U. S. Drought Monitor.
Global Drought Prediction Tool – NMME Multi-Model Ensemble SPI Forecast: Global SPI (3, 6, 9, or 12-month) maps of probabilistic forecasts.
Documentation
Documentation: for Global Drought Analysis Tool
Documentation: for Global Drought Prediction Tool