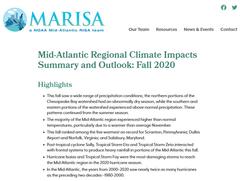
Quarterly Climate Impacts and Outlook for the Chesapeake Bay Region for September – November 2020. Dated December 2020.
https://www.midatlanticrisa.org/climate-summaries/2020/12.html

Quarterly Climate Impacts and Outlook for the Missouri River Basin September – November 2020. Dated December 2020.
Autumn 2020 was one of the driest on record for several states, including North Dakota (3rd), Colorado (9th), Nebraska (9th), Kansas (19th), and South Dakota (20th). Although temperatures were, overall, near normal, autumn had many extremes.
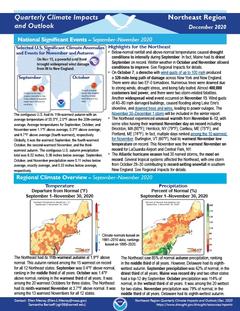
Quarterly Climate Impacts and Outlook for the Northeast Region for September – November 2020. Dated December 2020.
The Northeast had its 11th-warmest autumn at 1.9°F above normal. This autumn ranked among the 15 warmest on record for all 12 Northeast states. The Northeast saw 85% of normal autumn precipitation, ranking in the middle third of all years.

Quarterly Climate Impacts and Outlook for the Western Region for September – November 2020. Dated December 2020.
Temperatures were above-average during the fall west of the Rocky Mountains, favored by a strong high pressure ridge anchored along the coast. Although fall is typically dry in the southern half of the West, the persistent ridge prevented landfalling Pacific storms, leading to well-below normal precipitation in many regions.

Quarterly Climate Impacts and Outlook for the Southeast Region for September – November 2020. Dated December 2020.
Well-above-average temperatures were observed across the Southeast, driven primarily by excessively warm daily minimum temperatures. Precipitation was above average across much of the region. Several long-term stations observed their wettest autumn on record.

Quarterly Climate Impacts and Outlook for the Gulf of Maine Region for September – November 2020. Dated December 2020.
Autumn was up to 2°C (4°F) warmer than normal. This autumn was among the 10 warmest on record for Caribou and Portland, ME. Autumn precipitation ranged from 50% of normal to near normal for a majority of the region.

Quarterly Climate Impacts and Outlook for the Southern Region for September – November 2020. Dated December 2020.
Temperatures were below normal across much of the region in September and October, but November temperatures were above normal across the entire region. Precipitation was slightly above normal in September, but widespread areas received below normal precipitation in October and November.

Quarterly Climate Impacts and Outlook for Hawaii and the U.S. Pacific Islands Region for September – November 2020. Dated December 2020.
Includes significant events, regional climate overview, and sectoral impacts for September – November 2020; regional outlook for December 2020 – February 2021.

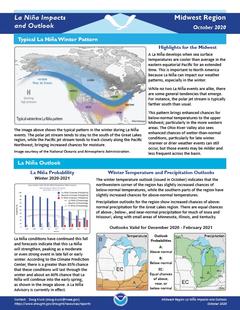
Provides information on the typical La Niña winter pattern; the La Niña outlook; potential impacts; and comparisons of conditions during previous La Niña years.
NOAA’s Regional Climate Services Program created these outlooks to inform the public about climate impacts within their respective regions. Each regional report contains easy-to-understand language, and anyone can access them through the Drought Portal.