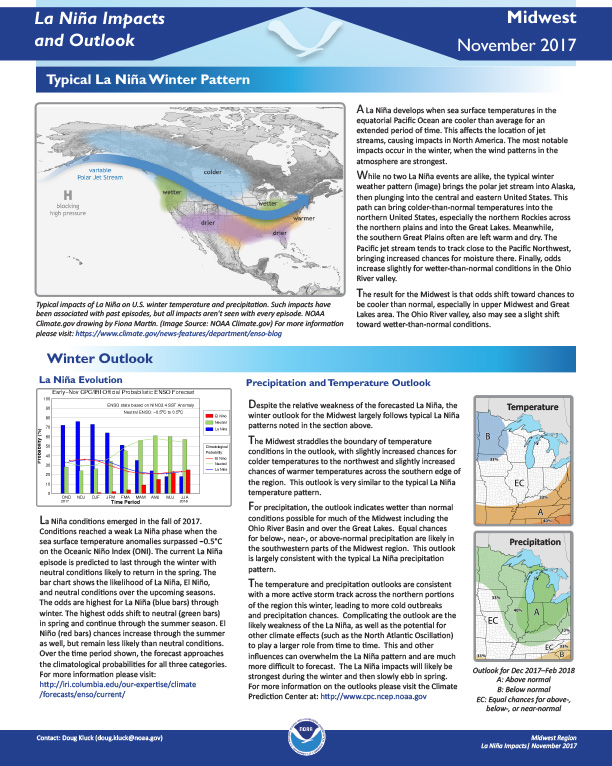
Discussion of La Niña in winter; outlook for precipitation and temperatures; impacts on agriculture, ecosystems/rivers, and the economy; how past La Niñas have unfolded.
NOAA’s Regional Climate Services Program created these Outlooks to inform the public about climate impacts within their respective regions. Each regional report contains easy-to-understand language, and anyone can access them through the Drought Portal at https://www.drought.gov/drought/resources/reports.
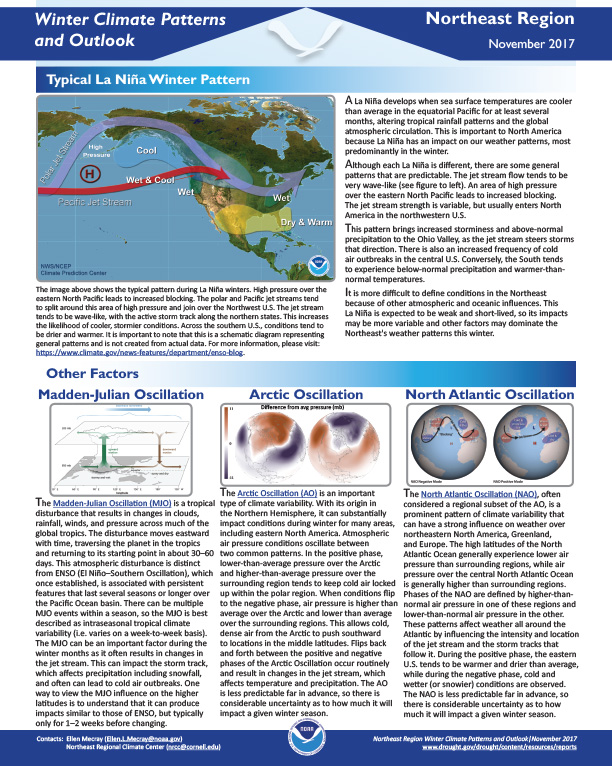
Describes typical La Niña winter patterns, Madden-Julian Oscillation, Arctic Oscillation, North Atlantic Oscillation; give outlook for winter temperatures and precipitation.
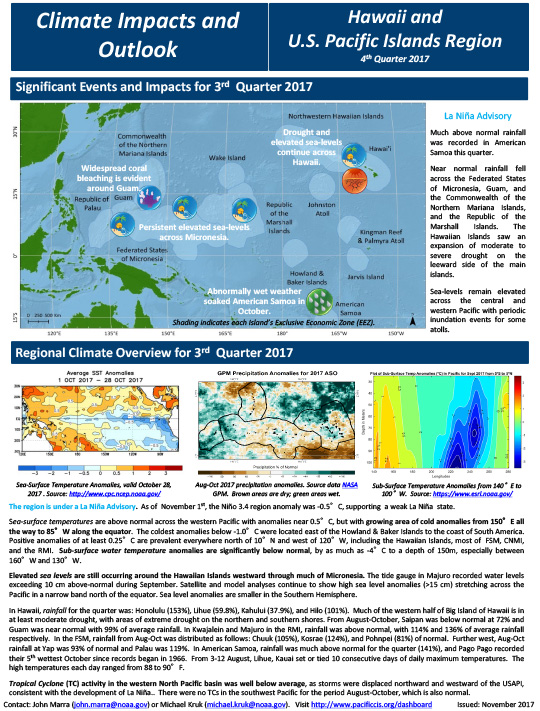
Quarterly Climate Impacts and Outlook for the Hawaii and the U.S. Pacific Islands Region for August – October 2017. Dated November 2017.
Includes significant events and impacts for Q3 2017; regional climate overview; sectoral impacts, and regional outlook for November 2017 through January 2018.
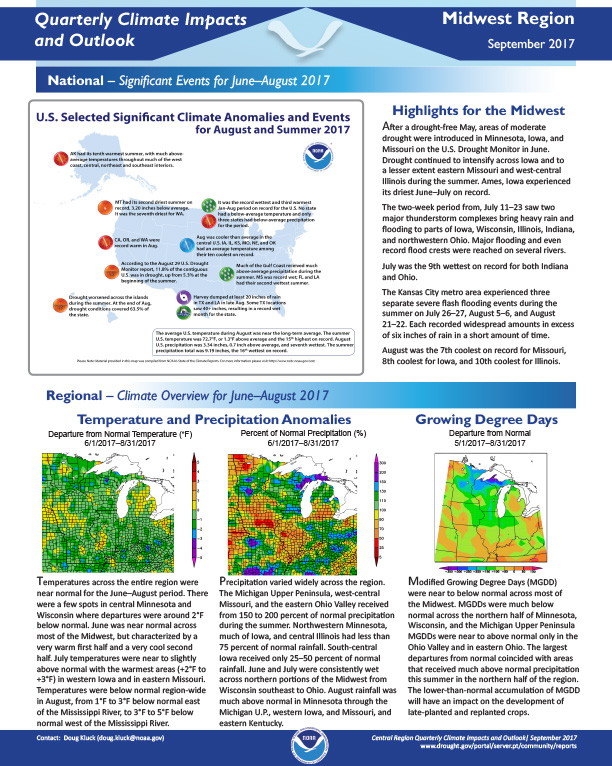
Quarterly Climate Impacts and Outlook for the Midwest Region for June – August 2017. Dated September 2017.
After a drought-free May, areas of moderate drought were introduced in Minnesota, Iowa, and Missouri on the U.S. Drought Monitor in June. Drought continued to intensify across Iowa and to a lesser extent eastern Missouri and west-central Illinois during the summer. Ames, Iowa experienced its driest June–July on record.

Quarterly Climate Impacts and Outlook for Alaska and Northwestern Canada for June – August 2017; outlook for October – December 2017. Dated September 2017.
Summer 2017 was significantly warmer than normal over most of the region, though Southeast Alaska and northern British Columbia were, overall, closer to normal. Precipitation, as is often the case in summer, was quite variable. Southern and northern coastal areas were wetter than average. Most inland areas and western Alaska had near normal rainfall but with small dry pockets.
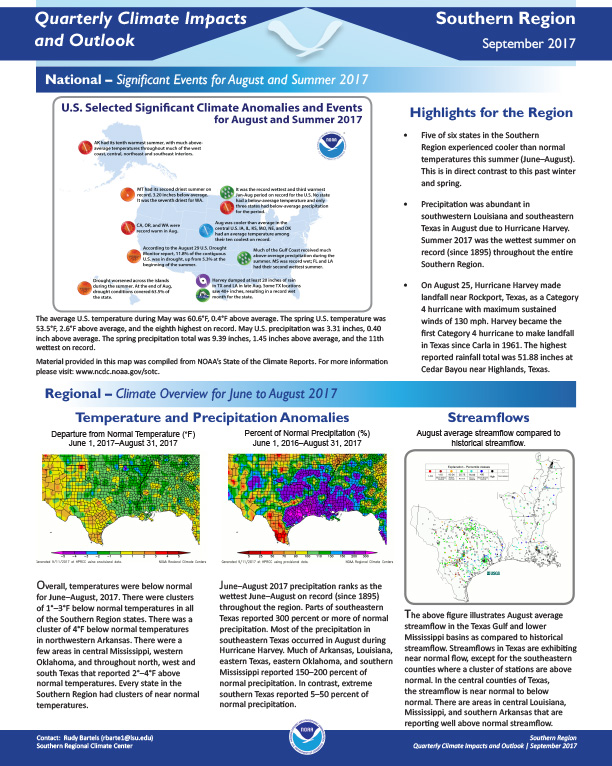
Quarterly Climate Impacts and Outlook for the Southern Region for June – August 2017. Dated September 2017.
Five of six states in the Southern Region experienced cooler than normal temperatures this summer (June–August). This is in direct contrast to this past winter and spring. Precipitation was abundant in southwestern Louisiana and southeastern Texas in August due to Hurricane Harvey. Summer 2017 was the wettest summer on record (since 1895) throughout the entire Southern Region.

Quarterly Climate Impacts and Outlook for the Great Lakes Region for June – August 2017. Dated September 2017.

Quarterly Climate Impacts and Outlook for the Western Region for June – August 2017. Dated September 2017.
Warmest summer on record for California and Nevada; second warmest for Oregon, 3rd warmest for Utah, and 4th for Washington and Arizona. Several locations set record for all-time warmest month in July: Reno, NV, Salt Lake City, UT, and Bakersfield, CA. Much drier than normal conditions across northern tier of West; Montana had 2nd driest summer on record. Moderate to exceptional drought conditions developed across Montana.

Quarterly Climate Impacts and Outlook for the Missouri River Basin June – August 2017. Dated September 2017.
Summer 2017 was full of extremes in the Basin. For example, Colorado had its 12th driest June followed by its 8th wettest July, while Nebraska had its 2nd driest June and its 12th wettest August. Montana’s weather was consistently warm and dry, with the state having its 2nd driest and 8th warmest summer on record (since 1895).

Quarterly Climate Impacts and Outlook for the Gulf of Maine Region for June – August 2017. Dated September 2017.
Summer was characterized by high variability in temperature, rainfall, and weather events. Moderate drought developed in portions of Maine and the Maritimes, while parts of Massachusetts and New Hampshire had several heavy rain events. There were multiple severe thunderstorm and flash flooding events throughout the
summer.