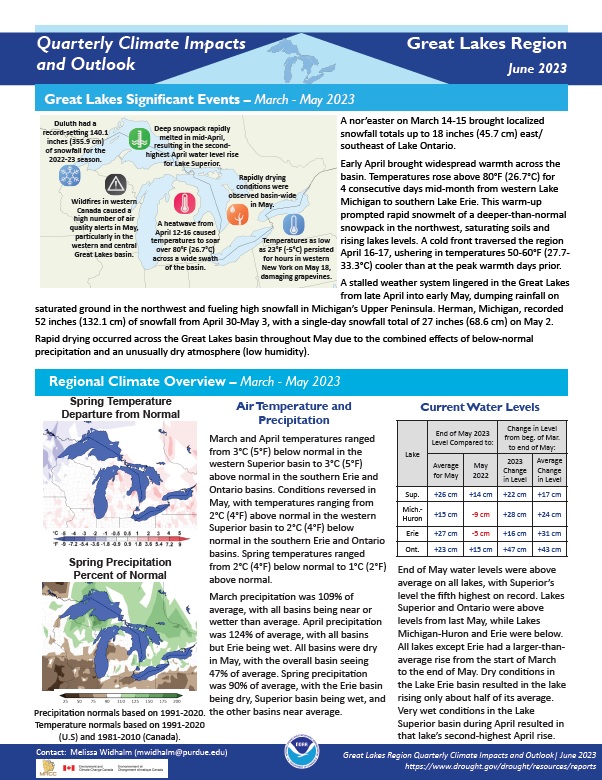
Quarterly Climate Impacts and Outlook for the Great Lakes Region for March–May 2023. Dated June 2023.
Spring temperatures ranged from 2°C (4°F) below normal to 1°C (2°F) above normal. Spring precipitation was 90% of average, with the Erie basin being dry, Superior basin being wet, and the other basins near average.
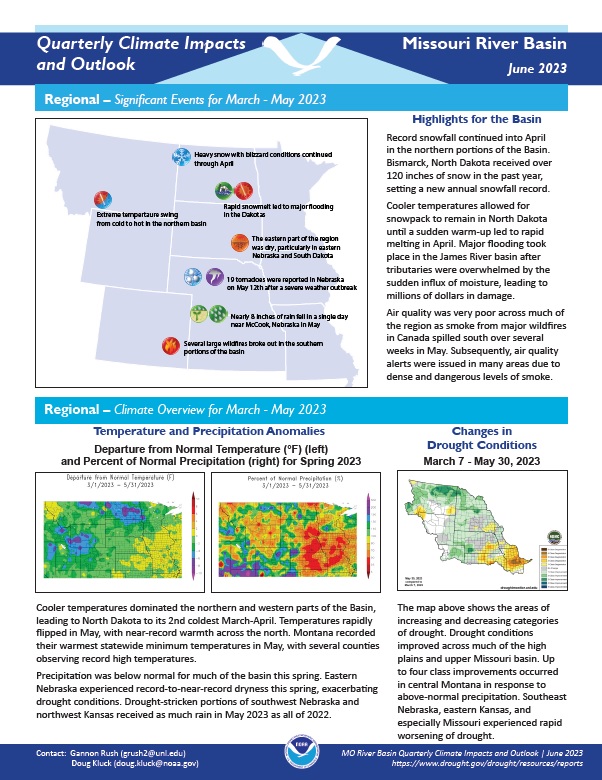
Quarterly Climate Impacts and Outlook for the Missouri River Basin for March–May 2023. Dated June 2023.
Cooler temperatures dominated the northern and western parts of the Basin, leading North Dakota to its 2nd coldest March–April. Temperatures rapidly flipped in May, with near-record warmth across the north. Precipitation was below normal for much of the basin this spring. Eastern Nebraska experienced record to near-record dryness this spring, exacerbating drought conditions.
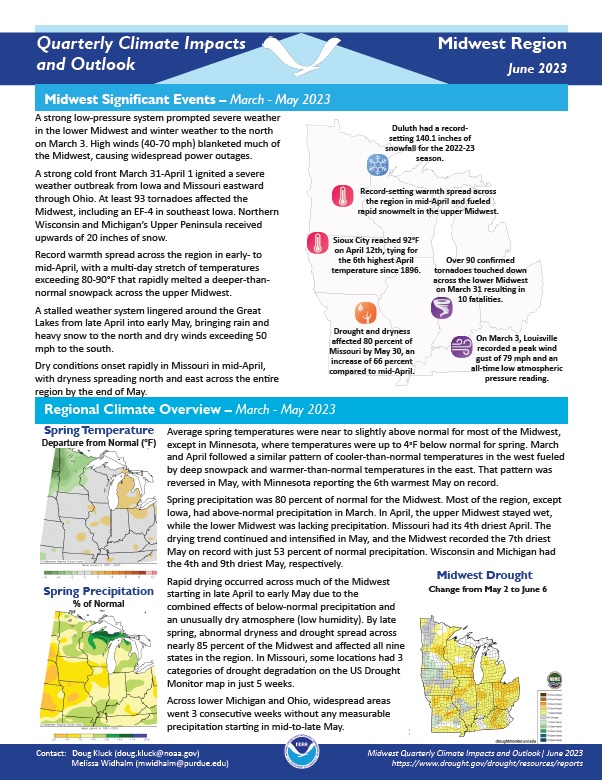
Quarterly Climate Impacts and Outlook for the Midwest Region for March–May 2023. Dated June 2023.
Average spring temperatures were near to slightly above normal for most of the Midwest, except in Minnesota, where temperatures were up to 4°F below normal for spring. Spring precipitation was 80% of normal for the Midwest.

Quarterly Climate Impacts and Outlook for the Southern Region for March–May 2023. Dated June 2023.
Spring temperatures were near normal across much of the Southern Region, with most stations averaging 1°F below to 1°F above normal. Along the Gulf Coast, temperatures at many stations were 1°F to 3°F above normal. Below-normal precipitation was common in central Oklahoma, northeastern Texas, the area north and west of San Antonio, far west Texas, eastern Tennessee, and much of Louisiana, with many stations receiving 25% to 70% of normal precipitation.

Quarterly Climate Impacts and Outlook for the Western Region for March–May 2023. Dated June 2023.
Temperatures were generally cool to cold west-wide, with notable cold anomalies along the California coast and in the interior Intermountain West. With few exceptions, spring was wetter than normal in the western U.S., largely owing to a wet March.

Quarterly Climate Impacts and Outlook for the Northeast Region for March–May 2023. Dated June 2023.
The Northeast had its 19th-warmest spring at 1.1°F above normal. This spring was among the 20 warmest since 1895 for 8 of the 12 Northeast states. The Northeast saw 81% of normal spring precipitation, in the driest third of all years. This spring was among the 20 driest since 1895 for 3 of the 12 Northeast states.

Quarterly Climate Impacts and Outlook for the Gulf of Maine Region for March–May 2023. Dated June 2023.
Spring was up to 3°C (5°F) warmer than normal. Spring precipitation ranged from 25% of normal to 125% of normal.
NOAA’s Regional Climate Services Program created these climate outlooks to inform the public about recent climate impacts within their respective regions. Each regional report contains easy-to-understand language, and anyone can access them through the Drought Portal.

Quarterly Climate Impacts and Outlook for the Southeast Region for March–May 2023. Dated June 2023.
Temperatures were near average across much of the Southeast, with a few locations either slightly above or slightly below average. Precipitation was variable across the Southeast.

Quarterly Climate Impacts and Outlook for the Pacific Region for March–May 2023. Dated June 2023.
For the March–May period, precipitation was above-normal across much of the Hawaiian Islands and U.S. Affiliated Pacific Islands (USAPI) including Guam, which observed its wettest March–May and May on record.
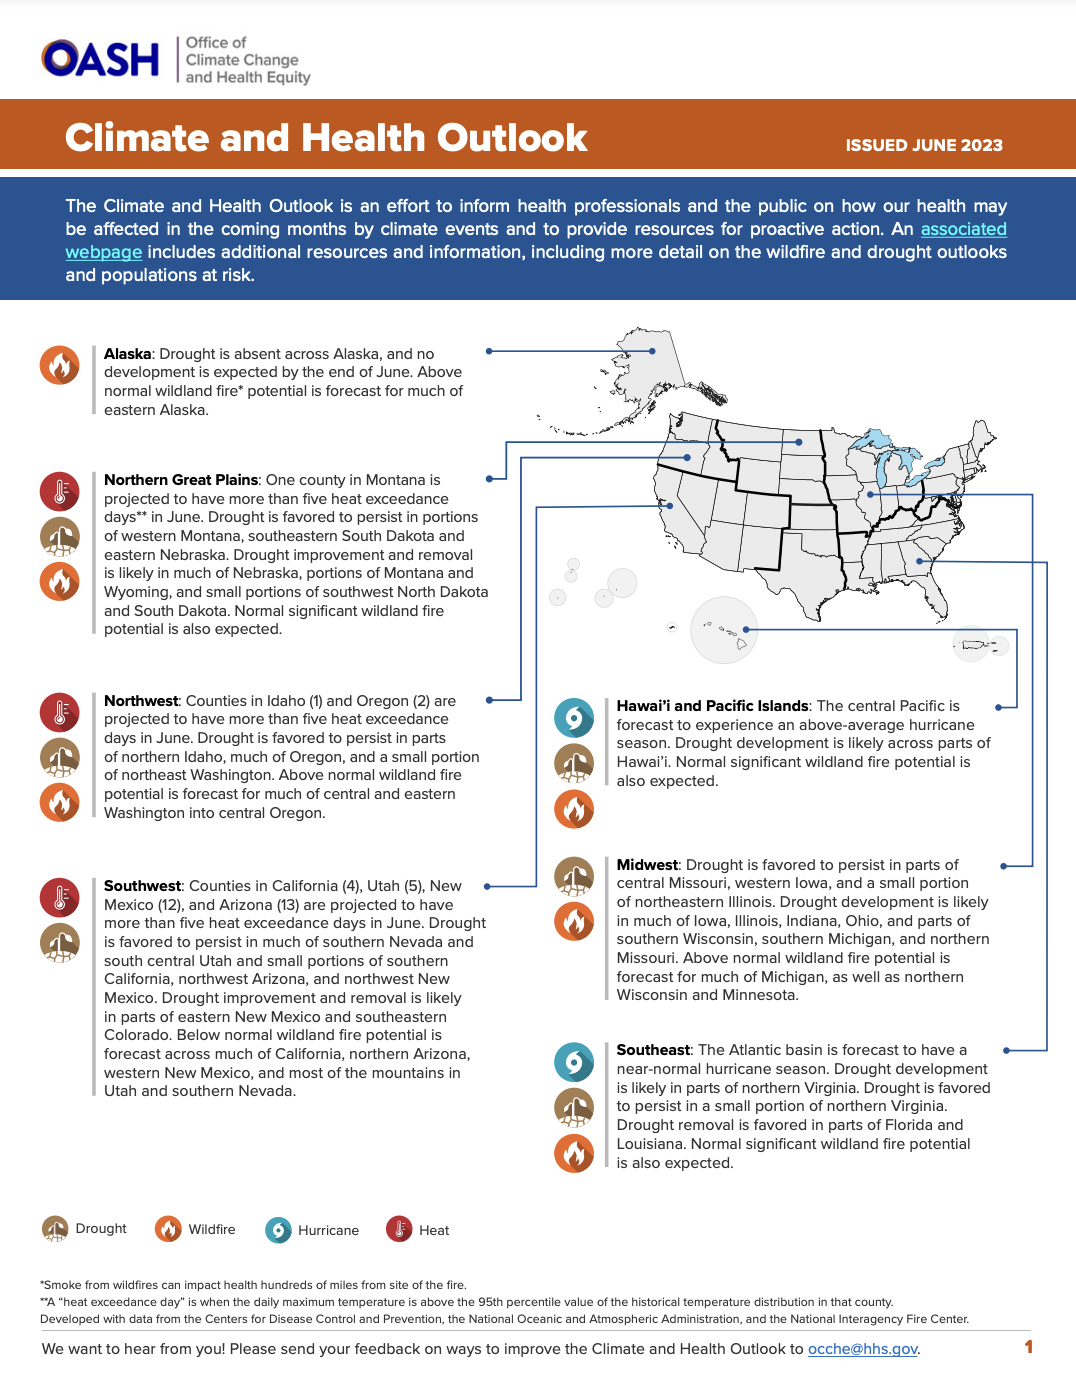
Produced by the U.S. Department of Health and Human Services (HHS) Office of Climate Change and Health Equity (OCCHE), the Climate and Health Outlook is an effort to inform health professionals and the public on how our health may be affected in the coming month(s) by climate events and to provide resources for proactive action.