
Quarterly Climate Impacts and Outlook for Hawaii and the U.S. Pacific Islands Region for March – May 2020. Dated June 2020.
Includes significant events, regional climate overview, and sectoral impacts for March – May 2020; regional outlook for June – August 2020.
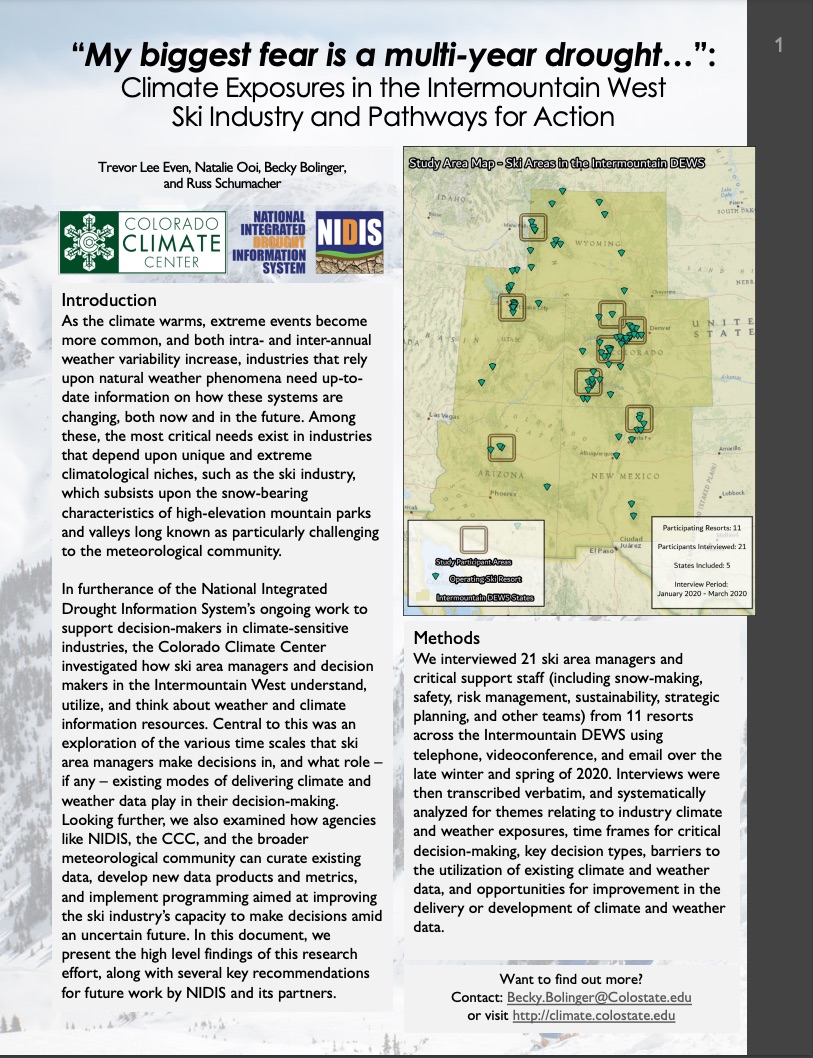
To further the National Integrated Drought Information System’s (NIDIS) ongoing work to support decision-makers in climate-sensitive industries, the Colorado Climate Center (CCC) investigated how ski area managers and decision makers in the Intermountain West understand, utilize, and think about weather and climate information resources. Central to this was an exploration of the various time scales that ski area managers make decisions in, and what role—if any—existing modes of delivering climate and weather data play in their decision-making.

A Red Flag Warning (RFW) is a term that has been used since the 1960s by the National Oceanic and Atmospheric Administration (NOAA) National Weather Service (NWS) fire weather forecasters to alert forecast users to an ongoing or imminent critical fire weather pattern. The warning is issued as needed for anywhere in the country.

Quarterly Climate Impacts and Outlook for Alaska and Northwestern Canada for December 2019 – February 2020; outlook for March – May 2020. Dated March 2020.
The winter period, December 2019 to February 2020, was colder than normal in almost all of Alaska and most of central and northern Yukon and Northwest Territories. This past winter was the first normally cold Yukon winter in the last few years.

Quarterly Climate Impacts and Outlook for the Great Lakes Region for December 2019 – February 2020. Dated March 2020.
Most of the Great Lakes states had one of their top 10 warmest winters on record. Winter was drier with the basin seeing 84% of average. There was below average ice cover due to warm air temperatures and lack of consecutive days below freezing.

Quarterly Climate Impacts and Outlook for the Missouri River Basin December 2019 – February 2020. Dated March 2020.
Seasonal temperatures for the majority of the Missouri Basin were much above normal. The main exception to this warmth was the mountainous areas of Colorado and Wyoming. Meanwhile, precipitation varied across the region, with the largest departures occurring across eastern parts of the region.
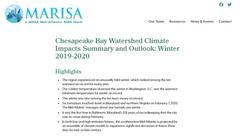
Quarterly Climate Impacts and Outlook for the Chesapeake Bay Region for December 2019 – February 2020. Dated March 2020.
The entire region experienced an unusually mild winter, which ranked among the ten warmest on record for many sites. Precipitation departures from normal show that the Chesapeake Bay watershed experienced both more and less precipitation than historical averages.
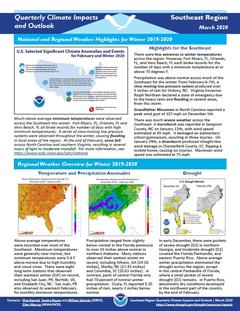
Quarterly Climate Impacts and Outlook for the Southeast Region for December 2019 – February 2020. Dated March 2020.
Above-average temperatures were recorded over most of the Southeast. Maximum temperatures were generally near normal, but minimum temperatures were 3-6 F above normal due to high humidity and cloud cover. Precipitation ranged from slightly below normal in the Florida peninsula to over 10 inches above normal in northern Alabama.

Quarterly Climate Impacts and Outlook for the Northeast Region for December 2019 – February 2020. Dated March 2020.
The Northeast had its seventh warmest winter at 4.1°F above normal. This winter was among the 10 warmest for all 12 Northeast states. The Northeast saw 113% of normal precipitation during winter, ranking in the wettest third of all years.

Quarterly Climate Impacts and Outlook for the Western Region for December 2019 – February 2020. Dated March 2020.
Winter temperatures were above normal for much of the West. Near to below normal temperatures were observed in the Central Rockies states. Scattered areas across the northern tier of the West reported above normal precipitation due to an active, poleward shifted storm track. In contrast, western Oregon and the Southwest observed near-to-below normal precipitation, due to persistent ridging during January and February.