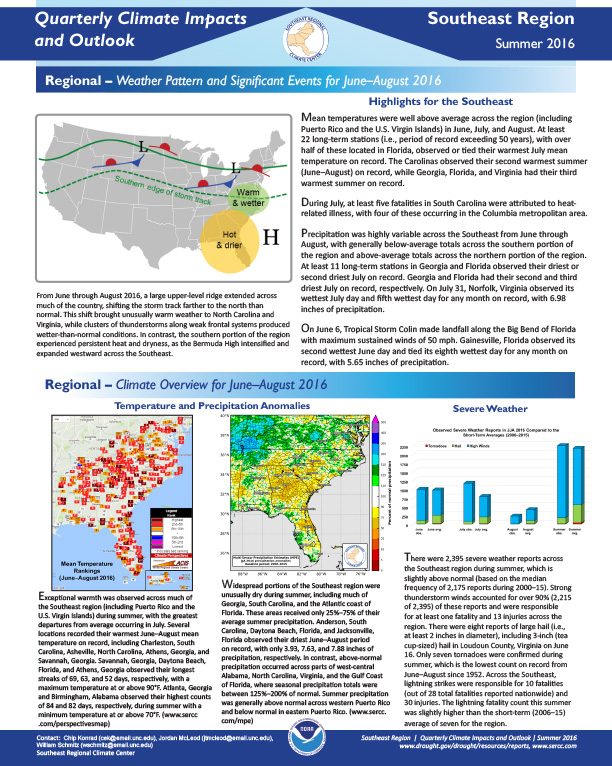
Quarterly Climate Impacts and Outlook for the Southeast Region for June – August 2016. Dated September 2016.
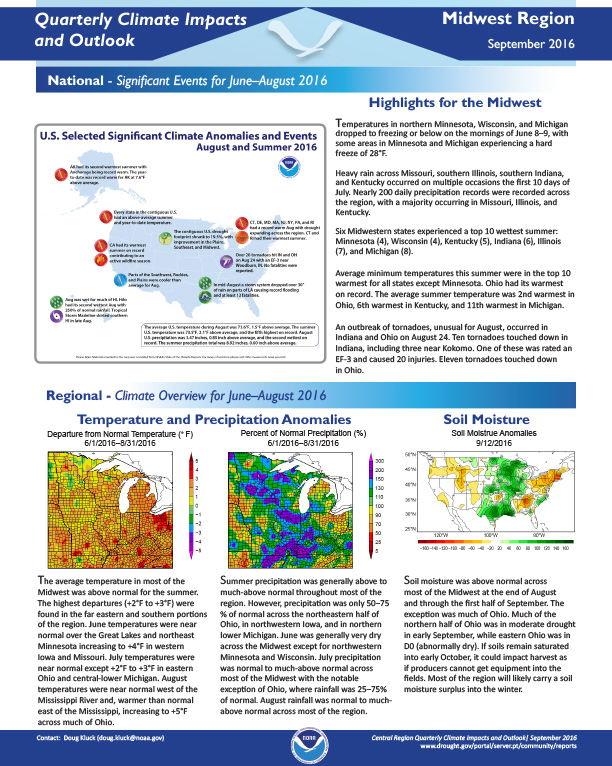
Quarterly Climate Impacts and Outlook for the Midwest Region for June – August 2016. Dated September 2016.
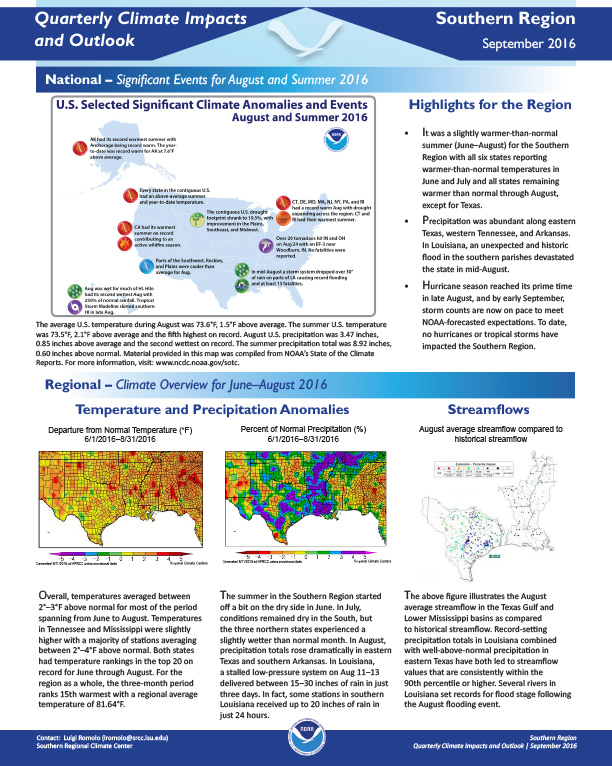
Quarterly Climate Impacts and Outlook for the Southern Region for June – August 2016. Dated September 2016.
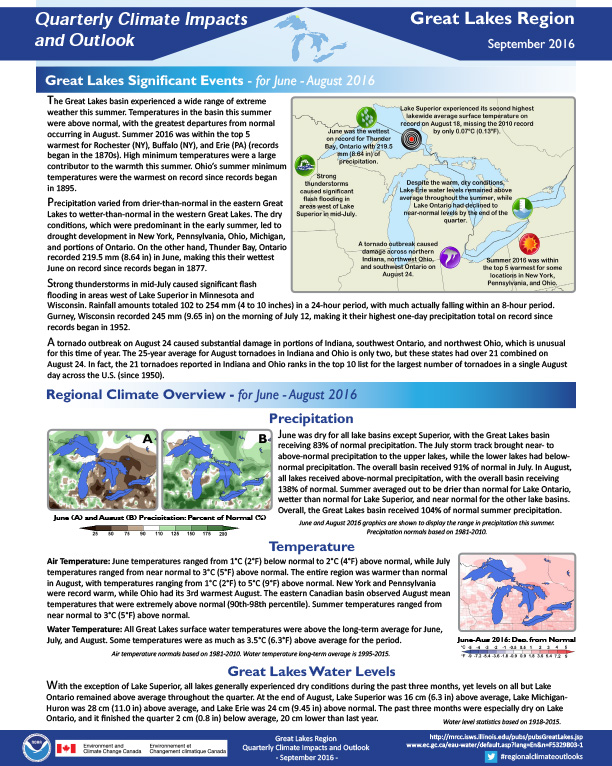
Quarterly Climate Impacts and Outlook for the Great Lakes Region for June – August 2016. Dated September 2016.

Quarterly Climate Impacts and Outlook for the Gulf of Maine Region for June – August 2016. Dated September 2016.

Quarterly Climate Impacts and Outlook for the Missouri River Basin June – August 2016. Dated September 2016.
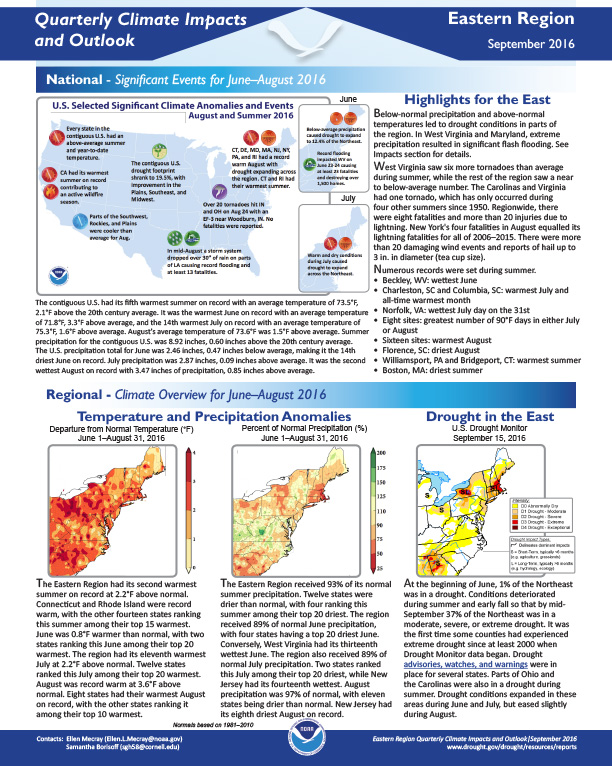
Quarterly Climate Impacts and Outlook for the Eastern Region for June – August 2016. Dated September 2016.
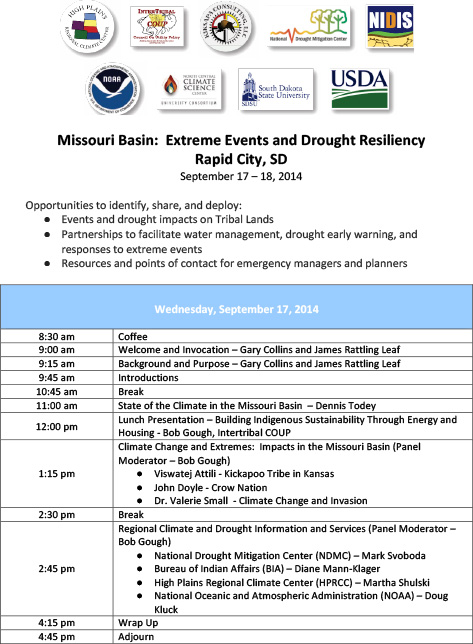
An agenda for the Extreme Events and Drought Resiliency workshop that took place in Rapid City, South Dakota September 17-18, 2014.
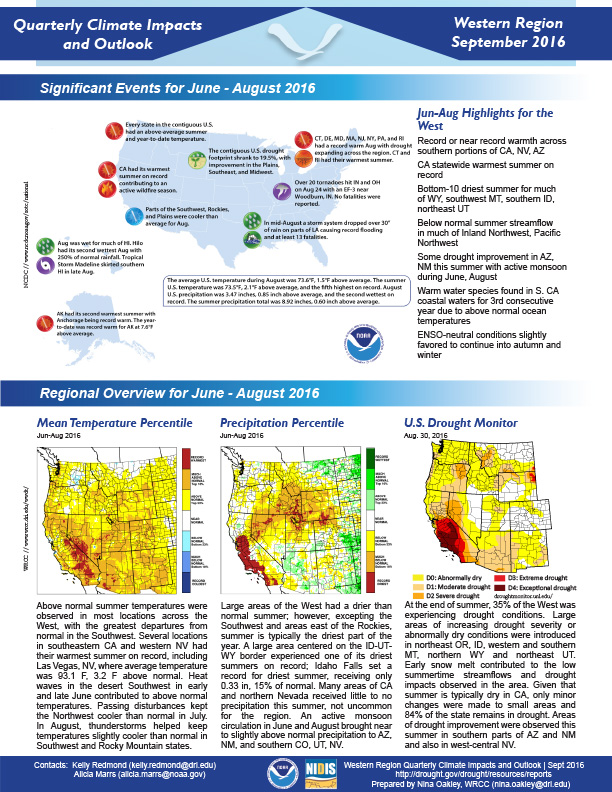
Quarterly Climate Impacts and Outlook for the Western Region for June – August 2016. Dated September 2016.
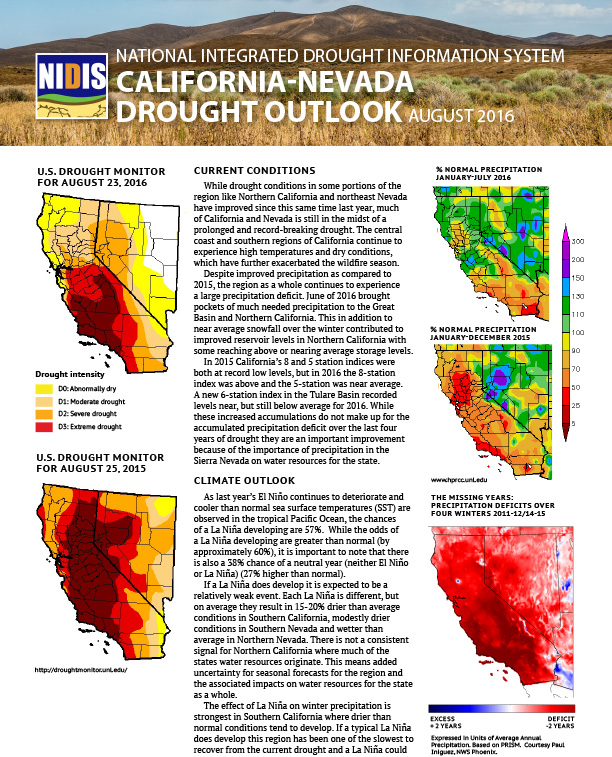
Document developed from California-Nevada Drought Early Warning System Drought & Climate Outlook Webinar on Aug. 24, 2016. Includes information on current conditions, the climate outlook, impacts, state actions in response to drought. Graphics include U.S. Drought Monitor compared year-over-year conditions; percent of normal precipitation Jan.-July 2016 and Jan.-Dec. 2015; precipitation deficits during winters of 2011-2015; more.