Despite recent precipitation, drought expected to intensify this summer
Key Points
- According to the U.S. Drought Monitor, 19.7% of the Pacific Northwest Drouight Early Warning System is in drought. The most intense conditions are in Idaho and Montana, where Severe Drought (D2) persists.
- On April 16, Washington issued a statewide drought declaration as winter conditions were warmer than normal, leading to below-normal snowpack across basins.
- Below-normal snowpack coupled with earlier snowmelt contributed to already declining streamflows across parts of the region, with forecasts predicting further declines.
- Despite recent rainfall, drought conditions are expected to worsen across the region with many sectors already anticipating drought in the summer months.
- Forecasted warmer-than-normal summer temperatures and below-normal precipitation are predicted to compound water supply challenges for reservoir managers, irrigators, small public water systems, and fisheries.
Current U.S. Drought Monitor map for the Pacific Northwest, as of June 4, 2024. The U.S. Drought Monitor (USDM) is updated each Thursday to show the location and intensity of drought across the country using 5 classifications: Abnormally Dry (D0), showing areas that may be going into or are coming out of drought, and four levels of drought (D1–D4).
The U.S. Drought Monitor is a joint effort of the National Drought Mitigation Center, U.S. Department of Agriculture, and National Oceanic and Atmospheric Administration.
A drought index combines multiple drought indicators (e.g., precipitation, temperature, soil moisture) to depict drought conditions. For some products, like the U.S. Drought Monitor, authors combine their analysis of drought indicators with input from local observers. Other drought indices, like the Standardized Precipitation Index (SPI), use an objective calculation to describe the severity, location, timing, and/or duration of drought.
Learn MorePeriods of drought can lead to inadequate water supply, threatening the health, safety, and welfare of communities. Streamflow, groundwater, reservoir, and snowpack data are key to monitoring and forecasting water supply.
Learn MoreDrought can reduce the water availability and water quality necessary for productive farms, ranches, and grazing lands, resulting in significant negative direct and indirect economic impacts to the agricultural sector. Monitoring agricultural drought typically focuses on examining levels of precipitation, evaporative demand, soil moisture, and surface/groundwater quantity and quality.
Learn MoreU.S. Drought Monitor Categories
% AreaD0 - Abnormally Dry
Abnormally Dry (D0) indicates a region that is going into or coming out of drought. View typical impacts by state.
D1 - Moderate Drought
Moderate Drought (D1) is the first of four drought categories (D1–D4), according to the U.S. Drought Monitor. View typical impacts by state.
D2 - Severe Drought
Severe Drought (D2) is the second of four drought categories (D1–D4), according to the U.S. Drought Monitor. View typical impacts by state.
D3 - Extreme Drought
Extreme Drought (D3) is the third of four drought categories (D1–D4), according to the U.S. Drought Monitor. View typical impacts by state.
D4 - Exceptional Drought
Exceptional Drought (D4) is the most intense drought category, according to the U.S. Drought Monitor. View typical impacts by state.
Total Area in Drought (D1–D4)
Percent area of the states in the Pacific Northwest that is currently in drought (D1–D4), according to the U.S. Drought Monitor.
Current U.S. Drought Monitor map for the Pacific Northwest, as of June 4, 2024. The U.S. Drought Monitor (USDM) is updated each Thursday to show the location and intensity of drought across the country using 5 classifications: Abnormally Dry (D0), showing areas that may be going into or are coming out of drought, and four levels of drought (D1–D4).
The U.S. Drought Monitor is a joint effort of the National Drought Mitigation Center, U.S. Department of Agriculture, and National Oceanic and Atmospheric Administration.
The U.S. Drought Monitor is updated every Thursday, with data valid through the previous Tuesday at 7 a.m. ET.
A drought index combines multiple drought indicators (e.g., precipitation, temperature, soil moisture) to depict drought conditions. For some products, like the U.S. Drought Monitor, authors combine their analysis of drought indicators with input from local observers. Other drought indices, like the Standardized Precipitation Index (SPI), use an objective calculation to describe the severity, location, timing, and/or duration of drought.
Learn MorePeriods of drought can lead to inadequate water supply, threatening the health, safety, and welfare of communities. Streamflow, groundwater, reservoir, and snowpack data are key to monitoring and forecasting water supply.
Learn MoreDrought can reduce the water availability and water quality necessary for productive farms, ranches, and grazing lands, resulting in significant negative direct and indirect economic impacts to the agricultural sector. Monitoring agricultural drought typically focuses on examining levels of precipitation, evaporative demand, soil moisture, and surface/groundwater quantity and quality.
Learn MoreCurrent Conditions
- An atmospheric river impacted the Pacific Northwest during the first few days of June, bringing record daily rainfall across the region, including in Seattle, Portland, Walla Walla, Olympia, and Pullman. While the precipitation from this event is helpful, the weather is predicted to become warmer and drier than normal into summer with high pressure building over the west into Oregon and southern Idaho.
- Severe (D2) and Extreme (D3) Drought in northern Idaho and western Montana reflect two winter seasons with reduced snowpack levels. While recent moisture in the region has been helpful, there is strong potential for drought to intensify in this area throughout summer.
- Well below-normal snowpack in Washington, northeast Oregon, and the mountains of central Idaho (Figure 1) led to concerns that water supply will be limited and ecosystems will become stressed as summer progresses.
- Over the last 60 days, precipitation (Figure 2) was below-normal across most of the region, except in western Washington and Oregon. Regions east of the Cascade Range in Washington and in southern Idaho recorded record dry conditions. Temperatures were near normal to below normal over the same period (Figure 3).
- In some areas of the Cascade Range, snow melted 19–50 days earlier than normal. Areas in central and eastern Washington and the Olympic Peninsula are already seeing streamflows drop below normal (Figure 4).
Figure 1. Snow Water Equivalent (SWE) Percent of 1991–2020 Median
Key Takeaway: Current snow water equivalent (SWE) in basins across the region reflects the warm winter temperatures in the areas where drought is most widespread or severe. SWE in the Central Columbia basin is 48% of normal (1991–2020 median). The Olympic Basin is at 40% of normal, and the Lower Yakima is 100% melted out, several weeks ahead of usual snowmelt timing. SWE in a majority of basins is below 80% of normal.
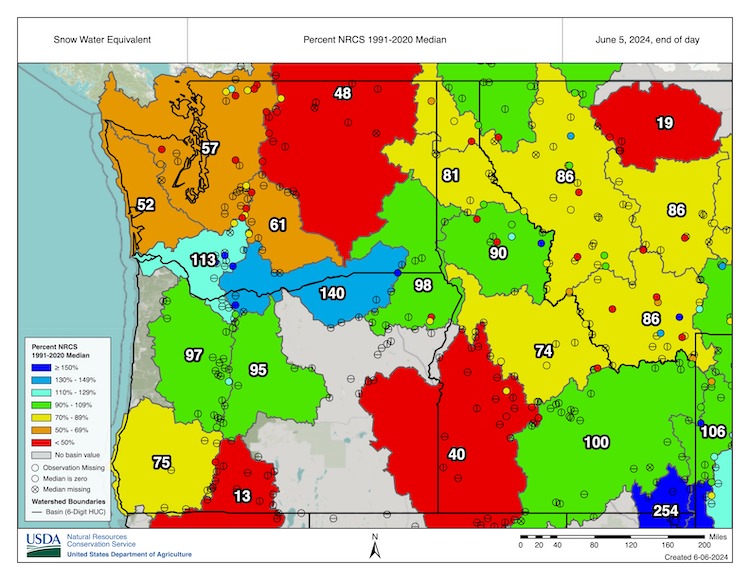
Figure 2. 60-Day Precipitation Percentiles (April 6–June 4, 2024)
Key Takeaway: Precipitation totals across large parts of the Pacific Northwest were below normal (in the bottom third of historical conditions). Precipitation percentiles were lowest in central Washington, with some values in the lowest 10% to record driest over the last 60 days.
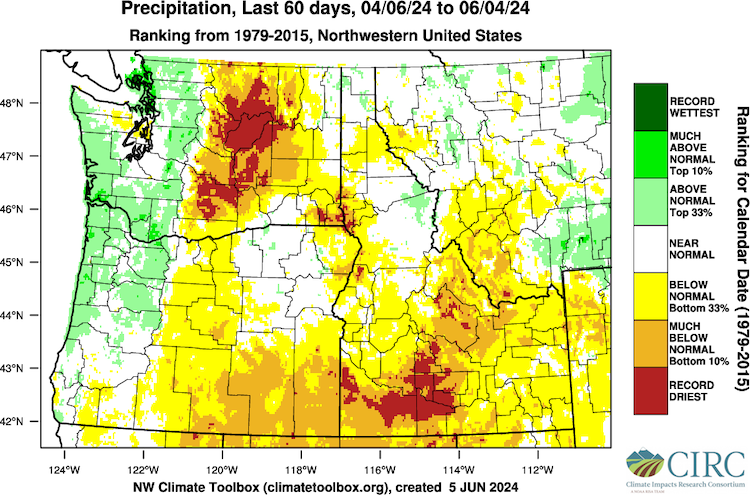
Figure 3. 60-Day Temperature Percentiles (April 6–June 4, 2024)
Key Takeaway: Spring temperatures across most of the Pacific Northwest were normal to below normal compared to 1979–2015.
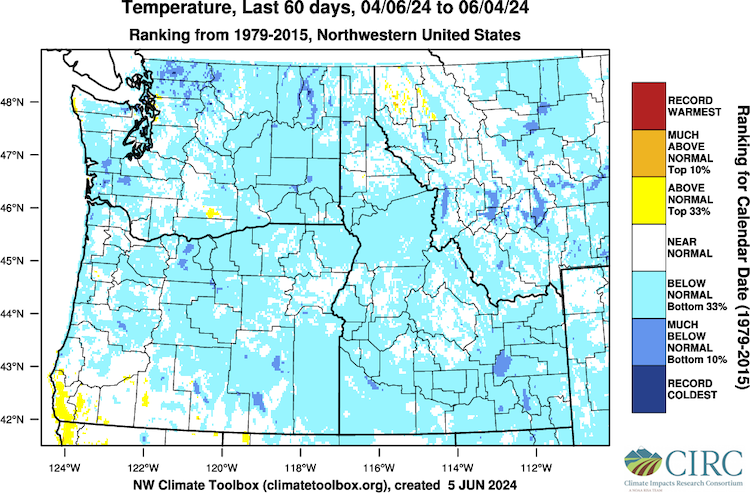
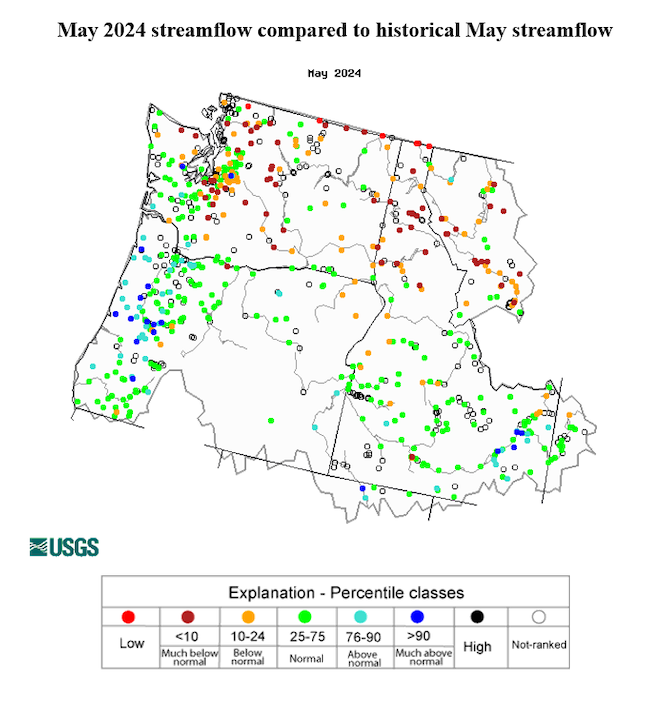
Figure 4. Monthly Average Streamflow (June 3, 2024)
Key Takeaway: Ongoing snowmelt and above-normal (110-150% of normal) May precipitation in some regions buffered some streamflows from falling below normal. Across Washington and northern Idaho, streamflows were generally below normal (below the 24th percentile) due to below-normal precipitation (5-50% of normal), Moderate to Severe Drought (D1–D2) conditions, and below-normal snow water equivalent (SWE) (46-83% of historical median).
Pacific Northwest Drought Impacts
- On April 16, 2024, Washington issued a statewide drought declaration, with a limited exclusion for the cities of Seattle, Tacoma, and Everett (no impacts to their water supply are anticipated due to reservoir size and early management actions). This declaration was primarily made because of below-normal snowpack, resulting from both below-normal mountain precipitation and above-normal temperatures. Snowpack is vital to water supply in the region. Multiple factors were considered in making the state declaration, including water supply impacts, precipitation, temperature, groundwater, soil moisture, and forecasts.
- Leveraging the drought declaration, irrigators in the Yakima and Skagit river basins used the emergency expedited water rights transfer process to mitigate drought impacts.
- A very dry April, coupled with sunny and windy conditions, contributed to abnormally high evaporation rates in much of Oregon at the start of May. This led to very dry soils in western and northern Oregon and record low streamflows in Oregon Coast Range watersheds. Although there was some rain and cooler temperatures later in May, blowing dust was reported in northeast Oregon (Figure 5).
- Due to below-normal snowpack in Washington and northeast Oregon and long-term drought impacts, some reservoirs did not fill up this spring, including the Yakima Basin (Figure 6), the Olympic Peninsula, the North Cascades, and the Central and Upper Columbia Basins in Washington; the Clearwater Reservoir in Idaho; and the Wickiup and Howard Prairie reservoirs in Oregon.
Report your local drought impacts through a Condition Monitoring Observer Report:
Figure 5. 0–100 cm Soil Moisture Conditions (June 6, 2024)
Key Takeaway: Variable spring climate across the region resulted in large differences in soil moisture. Soil moisture across much of southeastern Washington and in southern Oregon is well below normal, in the 0–20th percentile of historical conditions (1981–2013). Soil moisture in western Washington, eastern Oregon, and large parts of Idaho is well above normal in the 95-100th percentile.
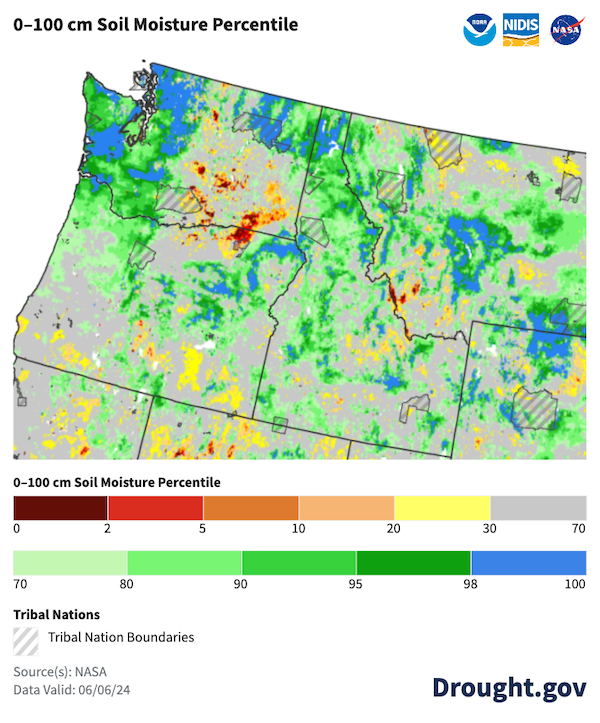
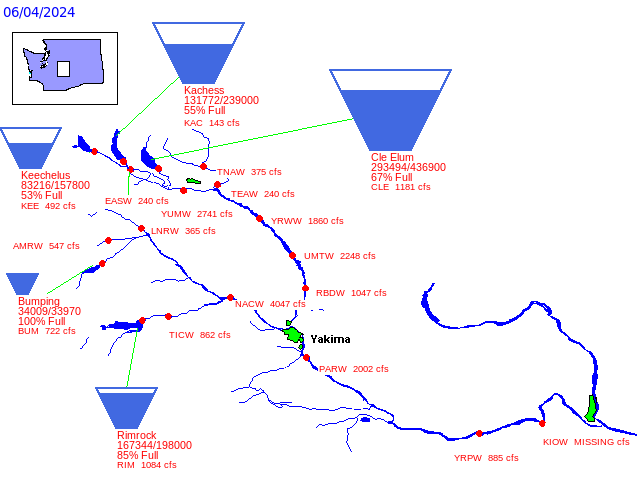
Figure 6. Bureau of Reclamation Major Storage Reservoirs in the Yakima Basin
Key Takeaway: Early snow melt and below-normal snow water equivalent (SWE) across the Yakima Basin in Washington resulted in water levels below the capacity of some reservoirs. Water levels in three of five reservoirs were near or below 65% of capacity before summer, when irrigation demands are heaviest.
Outlook and Potential Impacts for the Pacific Northwest
Outlooks & Forecasts for Summer 2024
- Although the Pacific Northwest received some precipitation in early June, the 6-10 day temperature and precipitation outlooks indicate above-normal temperatures and below-normal precipitation are likely across the region, especially in areas of Washington and Idaho that already are in drought. The Climate Prediction Center Seasonal Outlooks for June-July-August also suggest that above-normal temperatures and below- normal precipitation are likely across the region (Figure 7).
- The U.S. Seasonal Drought Outlook (Figure 8) predicts drought is likely to persist and become more severe across Washington, the Idaho panhandle, and central Idaho from June–August 2024. Given these long-term forecasts, adverse effects of heat are expected for water supply, human health, and agricultural production.
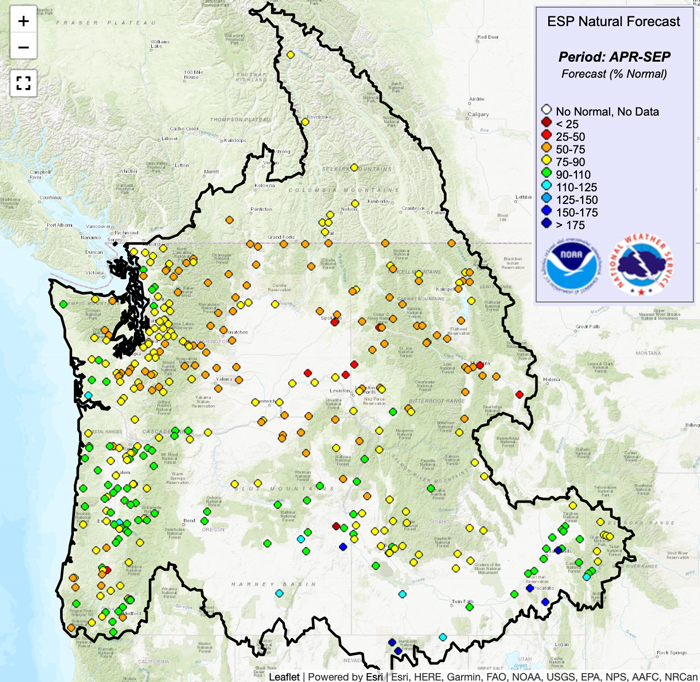
- The Northwest River Forecast Center Ensemble Streamflow Probabilistic (ESP) Natural Forecast for April–September (Figure 9) indicates that the water supply will continue to be limited in parts of the region. Runoff tends to be greatest in late spring and early summer. Therefore, runoff in the second half of summer may fall below normal. Predictions of hotter-than-normal temperatures and below-normal precipitation may make this worse.
Potential Impacts for Summer 2024
- The risk of wildfire is a concern this summer. The National Significant Wildland Fire Potential Outlook, released on June 1, 2024, indicates that fire potential will remain normal during June but become above normal across southeastern Oregon, southern Idaho, and northwestern Washington later in the summer.
- In areas where winter precipitation was about normal to above normal, robust growth of non-native invasive grasses created continuous fire fuels that may increase risk of wildfire expansion if an ignition occurs.
- In Washington’s agricultural areas, junior water rights holders are expected to be curtailed earlier this season due to low snowpack. Pro-rateable water users in Yakima (i.e., water users with 1905 water rights), are forecasted to receive 46-54% percent of their water supply.
- Forecasted high temperatures are expected to compound water supply challenges for producers, with higher evapotranspiration rates leading to increased water demand for irrigation. Producers therefore should anticipate the need to fallow land and cease irrigation this summer season.
- Dryland agriculture and pasture conditions are anticipated to deteriorate with higher-than-average temperatures. Hardship could include reduced water efficiency, lower stocking rates, and the need to haul water for livestock.
- River flows are projected to decline to levels at which fish will not be able to migrate later this summer, resulting in stranding and premature death of critical species. Tribal nations and the U.S. Department of Fish and Wildlife are planning for low streamflows and taking proactive actions to respond early to these projected impacts. Fish hatchery operations are expected to be disrupted due to inadequate river flows.
- Impacts are also anticipated on small and more vulnerable public water systems requiring water trucking, well deepening, and rehabilitation to support domestic water uses.
- While water supply in the central mountains of Idaho was lower than initially forecasted, strong carryover storage and high baseflows allowed nearly all reservoirs to fill, which should help mitigate drought impacts through the summer on irrigated agriculture in southern Idaho. However, northern Idaho is expecting much lower than normal streamflow throughout the summer, which is expected to limit power production and could result in increased stream temperatures should summer temperatures be higher than normal.
Figure 7: 3-Month Precipitation and Temperature Outlooks for June-July-August 2024
Key Takeaway: The Climate Prediction Center projects that temperatures are likely to be above normal, and precipitation below normal, from June–August 2024.
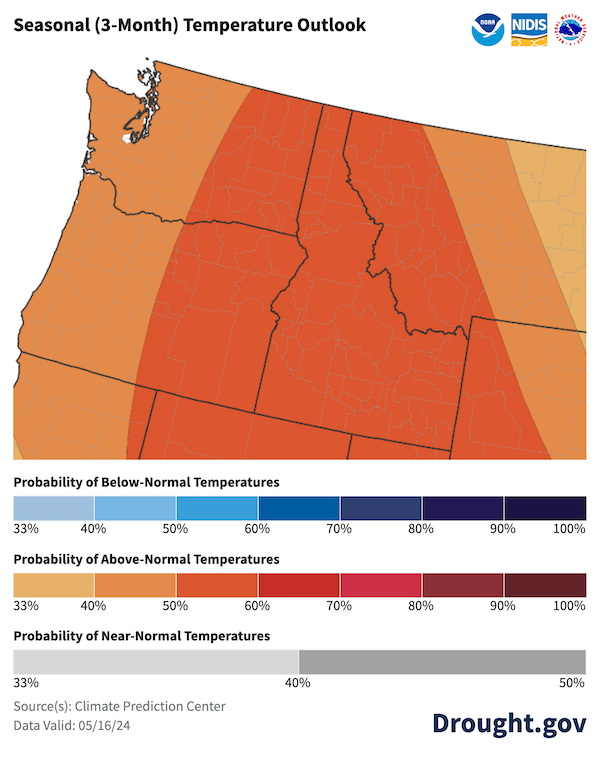
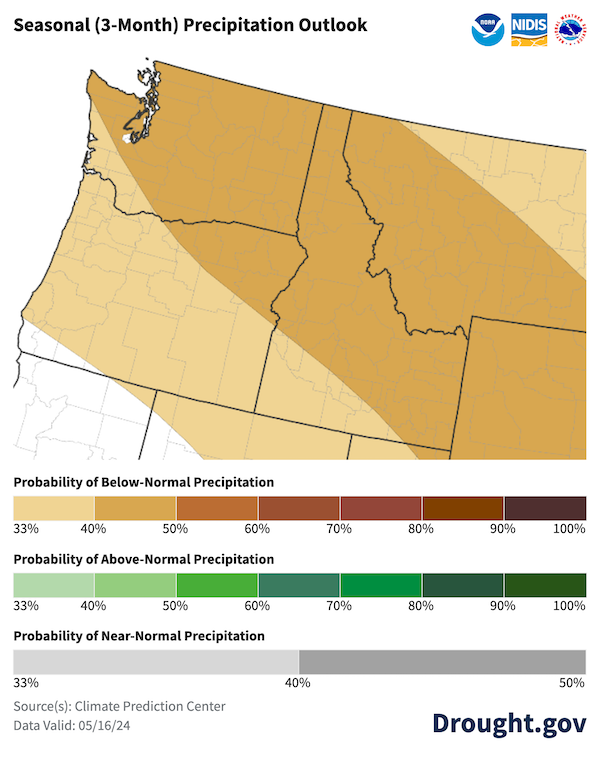
Figure 8. U.S. Seasonal (3-month) Drought Outlook
Key Takeaway: The NOAA Climate Prediction Center’s U.S. Seasonal Drought Outlook (valid June 1–August 31, 2024) indicates drought will persist in regions east of the Cascade Range in Washington and in the Idaho panhandle, with expansion of drought likely across all of Washington and south into central Idaho.
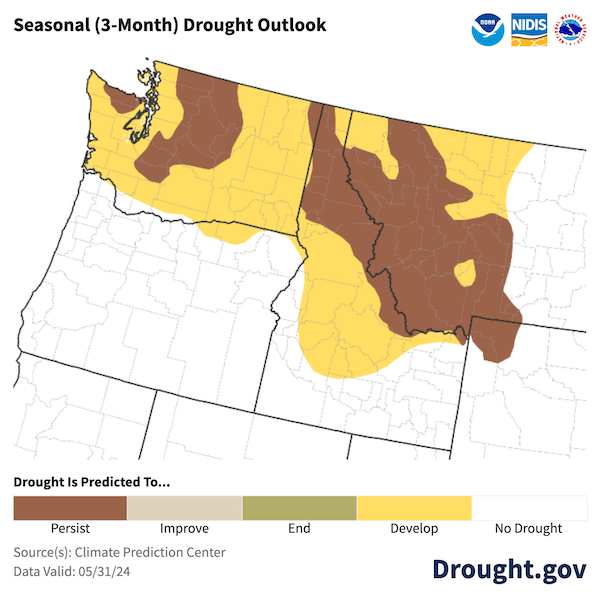
Figure 9. Northwest River Forecast Center Ensemble Streamflow Probabilistic Natural Forecast
Key Takeaway: The Northwest River Forecast Center Ensemble Streamflow Probabilistic Natural Forecast for June through September indicates that although runoff in some areas may be normal, runoff at many stations across Washington, Idaho, and northeastern Oregon will be 60-90% of normal, and runoff at a number of stations will be 26-50% of normal.
Resources
- NIDIS and its partners will issue future updates as conditions evolve.
- More local information is available from the following resources:
- Register for the next Pacific Northwest Drought Early Warning System Webinar on June 24 at 11 a.m. PDT.
Prepared By
Jason Gerlich
Cooperative Institute for Research in Environmental Sciences (CIRES), NOAA's National Integrated Drought Information System
Britt Parker
NOAA's National Integrated Drought Information System
Erica Fleishman
Oregon Climate Change Research Institute, Oregon State University
Caroline Mellor
Washington State Department of Ecology
Cameron Greenwood
Oregon Water Resources Department
Mattew Warbritton
USDA's Natural Resources Conservation Service
Karin Bumbaco
Office of the Washington State Climatologist, University of Washington
David Hoekema
Idaho Department of Water Resources
Larry O’Neill
Oregon Climate Service, Oregon State University
This Drought Status Update is issued in partnership by the National Oceanic and Atmospheric Administration (NOAA), Oregon Climate Change Research Institute, Washington State Department of Ecology, Oregon Water Resources Department, USDA Natural Resources Conservation Service, Office of the Washington State Climatologist, Idaho Department of Water Resources, and Oregon Climate Service to communicate potential areas of concern for drought expansion or development within the Pacific Northwest DEWS region on the basis of recent conditions and forecasts. NIDIS and its partners will issue future Drought Status Updates as conditions evolve.