U.S. Drought Monitor (USDM)
National Drought Mitigation Center (NDMC), the U.S. Department of Agriculture (USDA), the National Oceanic and Atmospheric Administration (NOAA), and the National Aeronautics and Space Administration (NASA)
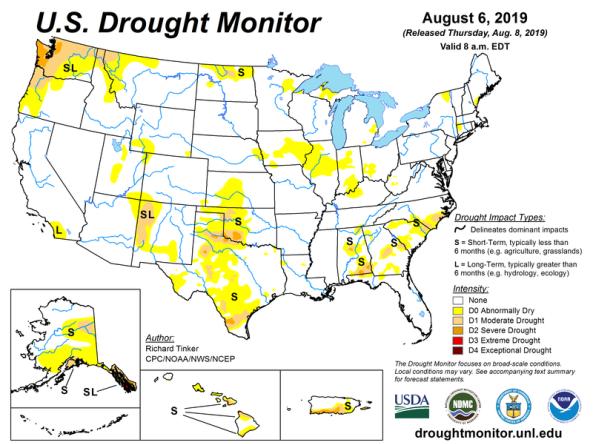
The U.S. Drought Monitor (USDM) is a map that is updated each Thursday to show the location and intensity of drought across the country. The USDM uses a five-category system, ranging from Abnormally Dry (D0, a precursor to drought, not actually drought), to Moderate (D1), Severe (D2), Extreme (D3) and Exceptional (D4) Drought. Drought categories show experts’ assessments of conditions related to dryness and drought including observations of how much water is available in streams, lakes, and soils compared to usual for the same time of year. The U.S. Drought Monitor began in 2000 and is a collaboration between the National Drought Mitigation Center, U.S. Department of Agriculture, National Oceanic and Atmospheric Administration, and National Aeronautics and Space Administration, who share the weekly author role for the product. The National Drought Mitigation Center, based at University of Nebraska, Lincoln, leads the coordination of weekly U.S. Drought Monitor process and provides the maps, data, and statistics to the public.
Where does this come from?
Each week, the U.S. Drought Monitor authors consider how recent precipitation totals across the country compare to their long-term averages. They check variables including temperatures, soil moisture, water levels in streams and lakes, snow cover, and meltwater runoff. The authors also check whether areas are showing drought impacts, such as water shortages and business interruptions. Based on dozens of indicators, experts make their best judgments of regional-scale drought conditions, and then check their assessments with experts in the field before publishing weekly drought maps. Associated statistics show what proportion of various geographic areas are in each category of dryness or drought and estimate how many people are affected. Learn more about how the map is made.
The U.S. Drought Monitor is updated each Thursday to show the location and intensity of drought across the country, which uses a five-category system, from Abnormally Dry (D0) conditions to Exceptional Drought (D4).
The U.S. Drought Monitor is a joint effort of the National Drought Mitigation Center, U.S. Department of Agriculture, National Oceanic and Atmospheric Administration, and National Aeronautics and Space Administration. Authors from these agencies rotate creating the map each week, using both physical indicators and input from local observers.
A drought index combines multiple drought indicators (e.g., precipitation, temperature, soil moisture) to depict drought conditions. For some products, like the U.S. Drought Monitor, authors combine their analysis of drought indicators with input from local observers. Other drought indices, like the Standardized Precipitation Index (SPI), use an objective calculation to describe the severity, location, timing, and/or duration of drought.
Learn MorePeriods of drought can lead to inadequate water supply, threatening the health, safety, and welfare of communities. Streamflow, groundwater, reservoir, and snowpack data are key to monitoring and forecasting water supply.
Learn MoreDrought can reduce the water availability and water quality necessary for productive farms, ranches, and grazing lands, resulting in significant negative direct and indirect economic impacts to the agricultural sector. Monitoring agricultural drought typically focuses on examining levels of precipitation, evaporative demand, soil moisture, and surface/groundwater quantity and quality.
Learn MoreU.S. Drought Monitor Categories
Abnormally Dry (D0)
Abnormally Dry (D0) indicates a region that is going into or coming out of drought. View typical impacts by state.
Moderate Drought (D1)
Moderate Drought (D1) is the first of four drought categories (D1–D4), according to the U.S. Drought Monitor. View typical impacts by state.
Severe Drought (D2)
Severe Drought (D2) is the second of four drought categories (D1–D4), according to the U.S. Drought Monitor. View typical impacts by state.
Extreme Drought (D3)
Extreme Drought (D3) is the third of four drought categories (D1–D4), according to the U.S. Drought Monitor. View typical impacts by state.
Exceptional Drought (D4)
Exceptional Drought (D4) is the most intense drought category, according to the U.S. Drought Monitor. View typical impacts by state.
The U.S. Drought Monitor is updated each Thursday to show the location and intensity of drought across the country, which uses a five-category system, from Abnormally Dry (D0) conditions to Exceptional Drought (D4).
The U.S. Drought Monitor is a joint effort of the National Drought Mitigation Center, U.S. Department of Agriculture, National Oceanic and Atmospheric Administration, and National Aeronautics and Space Administration. Authors from these agencies rotate creating the map each week, using both physical indicators and input from local observers.
The U.S. Drought Monitor is released every Thursday morning, with data valid through Tuesday at 7am Eastern.
A drought index combines multiple drought indicators (e.g., precipitation, temperature, soil moisture) to depict drought conditions. For some products, like the U.S. Drought Monitor, authors combine their analysis of drought indicators with input from local observers. Other drought indices, like the Standardized Precipitation Index (SPI), use an objective calculation to describe the severity, location, timing, and/or duration of drought.
Learn MorePeriods of drought can lead to inadequate water supply, threatening the health, safety, and welfare of communities. Streamflow, groundwater, reservoir, and snowpack data are key to monitoring and forecasting water supply.
Learn MoreDrought can reduce the water availability and water quality necessary for productive farms, ranches, and grazing lands, resulting in significant negative direct and indirect economic impacts to the agricultural sector. Monitoring agricultural drought typically focuses on examining levels of precipitation, evaporative demand, soil moisture, and surface/groundwater quantity and quality.
Learn MoreAccess
Compare Two Weeks: Compare two U.S. Drought Monitor weeks side by side.
USDM Map Comparison Slider: Displays the USDM maps from two selected dates with a slider bar to compare how dry and drought areas changed.
Time Series: View a graph of the U.S. Drought Monitor statistics for a chosen area.
Map Archive: View any map format for a selected week.
Drought Summary: View the weekly narrative for a selected week.
USDM Change Maps: View a series of change maps for a selected week.
USDM Animations: View an animation of maps for a selected period or download animated GIF files.
Drought.gov Historical Time Series Tool: View the time series and maps in a unified page.
Tabular Data Tables: View the U.S. Drought Monitor data in tabular format for a selected area.
Web Services / GIS data: Download data in GIS formats and access Web Map Service endpoints.
Get Emails When Conditions Change
Want to receive emails when U.S. Drought Monitor conditions change for your location? Sign up for Drought.gov's local drought alert emails.
Documentation
U.S. Drought Monitor Background: Helpful links to general information, specific technical instructions, and referenced articles related to this dataset.
U.S. Drought Monitor Percentiles: Explanation of the Drought Monitor percentile category ranges.
Relevant publications:
Svoboda, M., and Coauthors, 2002: The Drought Monitor. Bull. Amer. Meteor. Soc., 83, 1181–1190, doi:https://doi.org/10.1175/1520-0477-83.8.1181