Extreme Drought in Southern California and Nevada Continues Despite Ongoing Precipitation
Our thoughts are with all of those, including many of our partners, who have been impacted by the devastating wildfires in Los Angeles County. Please stay alert to potential additional impacts from the current atmospheric river, including floods or debris flows resulting from heavy rainfall.
Key Points
- A record-setting dry start to the water year in southern California and Nevada led to Extreme Drought (D3) in the region—and now Exceptional Drought (D4) in Nevada—according to the U.S. Drought Monitor.
- The first four months of Water Year 2025 were among the top three driest October–January periods on record for California's South Coast Drainage (2nd driest) and Southeast Desert Basin (3rd driest) climate divisions and Nevada's South Central (3rd driest) and Extreme Southern (driest) climate divisions.
- A recent storm and an ongoing atmospheric river are bringing much needed precipitation to central and southern California and Nevada. This will mitigate some of the most acute drought impacts, but drought conditions will remain. Drought preparedness is key for California and Nevada.
- After the ongoing atmospheric river event, outlooks suggest a lull in precipitation over the next 2 weeks and potentially beyond.
The U.S. Drought Monitor depicts the location and intensity of drought across the country. The map uses 5 classifications: Abnormally Dry (D0), showing areas that may be going into or are coming out of drought, and four levels of drought (D1–D4).
The U.S. Drought Monitor is a joint effort of the National Oceanic and Atmospheric Administration, U.S. Department of Agriculture, and National Drought Mitigation Center.
This 4-week U.S. Drought Monitor change map shows where drought has improved, degraded, or remained the same from January 14–February 11, 2025.
Yellow shades indicate drought degradation, while green shades indicate drought improvement, according to the U.S. Drought Monitor.
A drought index combines multiple drought indicators (e.g., precipitation, temperature, soil moisture) to depict drought conditions. For some products, like the U.S. Drought Monitor, authors combine their analysis of drought indicators with input from local observers. Other drought indices, like the Standardized Precipitation Index (SPI), use an objective calculation to describe the severity, location, timing, and/or duration of drought.
Learn MorePeriods of drought can lead to inadequate water supply, threatening the health, safety, and welfare of communities. Streamflow, groundwater, reservoir, and snowpack data are key to monitoring and forecasting water supply.
Learn MoreDrought can reduce the water availability and water quality necessary for productive farms, ranches, and grazing lands, resulting in significant negative direct and indirect economic impacts to the agricultural sector. Monitoring agricultural drought typically focuses on examining levels of precipitation, evaporative demand, soil moisture, and surface/groundwater quantity and quality.
Learn MoreA drought index combines multiple drought indicators (e.g., precipitation, temperature, soil moisture) to depict drought conditions. For some products, like the U.S. Drought Monitor, authors combine their analysis of drought indicators with input from local observers. Other drought indices, like the Standardized Precipitation Index (SPI), use an objective calculation to describe the severity, location, timing, and/or duration of drought.
Learn MorePeriods of drought can lead to inadequate water supply, threatening the health, safety, and welfare of communities. Streamflow, groundwater, reservoir, and snowpack data are key to monitoring and forecasting water supply.
Learn MoreDrought can reduce the water availability and water quality necessary for productive farms, ranches, and grazing lands, resulting in significant negative direct and indirect economic impacts to the agricultural sector. Monitoring agricultural drought typically focuses on examining levels of precipitation, evaporative demand, soil moisture, and surface/groundwater quantity and quality.
Learn MoreDrought & Dryness Categories
% AreaD0 – Abnormally Dry
Abnormally Dry (D0) indicates a region that is going into or coming out of drought.
D1 – Moderate Drought
Moderate Drought (D1) is the first of four drought categories (D1–D4), according to the U.S. Drought Monitor.
D2 – Severe Drought
Severe Drought (D2) is the second of four drought categories (D1–D4), according to the U.S. Drought Monitor.
D3 – Extreme Drought
Extreme Drought (D3) is the third of four drought categories (D1–D4), according to the U.S. Drought Monitor.
D4 – Exceptional Drought
Exceptional Drought (D4) is the most intense drought category, according to the U.S. Drought Monitor.
Total Area in Drought (D1–D4)
Percent area of the California–Nevada region that is currently in drought (D1–D4), according to the U.S. Drought Monitor.
Drought Change Since Last Week
3-Category Degradation
Drought/dryness has worsened by 3 categories, according to the U.S. Drought Monitor.
2-Category Degradation
Drought/dryness has worsened by 2 categories, according to the U.S. Drought Monitor.
1-Category Degradation
Drought/dryness has worsened by 1 category, according to the U.S. Drought Monitor.
No Change
There has been no change in drought conditions at this location.
1-Category Improvement
Drought/dryness has improved by 1 category, according to the U.S. Drought Monitor.
2-Category Improvement
Drought/dryness has improved by 2 categories, according to the U.S. Drought Monitor.
3-Category Improvement
Drought/dryness has improved by 3 categories, according to the U.S. Drought Monitor.
The U.S. Drought Monitor depicts the location and intensity of drought across the country. The map uses 5 classifications: Abnormally Dry (D0), showing areas that may be going into or are coming out of drought, and four levels of drought (D1–D4).
The U.S. Drought Monitor is a joint effort of the National Oceanic and Atmospheric Administration, U.S. Department of Agriculture, and National Drought Mitigation Center.
This 4-week U.S. Drought Monitor change map shows where drought has improved, degraded, or remained the same from January 14–February 11, 2025.
Yellow shades indicate drought degradation, while green shades indicate drought improvement, according to the U.S. Drought Monitor.
This U.S. Drought Monitor is released every Thursday morning, with data valid through Tuesday at 7 a.m. ET.
This U.S. Drought Monitor (USDM) and USDM change maps are released every Thursday morning, with data valid through Tuesday at 7 a.m. ET.
A drought index combines multiple drought indicators (e.g., precipitation, temperature, soil moisture) to depict drought conditions. For some products, like the U.S. Drought Monitor, authors combine their analysis of drought indicators with input from local observers. Other drought indices, like the Standardized Precipitation Index (SPI), use an objective calculation to describe the severity, location, timing, and/or duration of drought.
Learn MorePeriods of drought can lead to inadequate water supply, threatening the health, safety, and welfare of communities. Streamflow, groundwater, reservoir, and snowpack data are key to monitoring and forecasting water supply.
Learn MoreDrought can reduce the water availability and water quality necessary for productive farms, ranches, and grazing lands, resulting in significant negative direct and indirect economic impacts to the agricultural sector. Monitoring agricultural drought typically focuses on examining levels of precipitation, evaporative demand, soil moisture, and surface/groundwater quantity and quality.
Learn MoreA drought index combines multiple drought indicators (e.g., precipitation, temperature, soil moisture) to depict drought conditions. For some products, like the U.S. Drought Monitor, authors combine their analysis of drought indicators with input from local observers. Other drought indices, like the Standardized Precipitation Index (SPI), use an objective calculation to describe the severity, location, timing, and/or duration of drought.
Learn MorePeriods of drought can lead to inadequate water supply, threatening the health, safety, and welfare of communities. Streamflow, groundwater, reservoir, and snowpack data are key to monitoring and forecasting water supply.
Learn MoreDrought can reduce the water availability and water quality necessary for productive farms, ranches, and grazing lands, resulting in significant negative direct and indirect economic impacts to the agricultural sector. Monitoring agricultural drought typically focuses on examining levels of precipitation, evaporative demand, soil moisture, and surface/groundwater quantity and quality.
Learn MoreThis update is based on data available as of Thursday, February 13, 2025 at 7:00 a.m. PT. We acknowledge that conditions are evolving.
Current Drought Conditions for California/Nevada
- This past January was the 9th driest in California and 10th driest in Nevada since 1895.
- Although California experienced two significant storms since the beginning of February, drought expanded and intensified throughout the region over the last month. Drought depictions to this point have been led by short-term drought impacts (i.e., impacts that typically occur in less than 6 months, such as impacts to agriculture and grasslands), but this week’s U.S. Drought Monitor indicates a shift to both short- and long-term drought impacts (i.e., greater than 6 months, such as impacts to hydrology and ecology).
- The northern part of California and Nevada continue to track well-above normal precipitation, while the central and southern portions of the region received well-below-normal precipitation for the water year (Figure 1). Parts of southern Nevada are experiencing the driest start to the water year in a 44-year record. This is a stark contrast to northeastern California and northwestern Nevada, which are experiencing the wettest start to the water year in record (Figure 2).
- The landfalling atmospheric river currently impacting central and southern California has brought nearly 2% of water year precipitation to the Los Angeles and San Diego region as of the morning of Thursday, February 13. It is forecast to reach inland, bringing additional precipitation to central and southern Nevada.
- Current snow water equivalent (SWE, Figure 3) status exhibits a similar contrast between the north and south. This month’s western snow drought status update reported below normal snowpack in most of the Sierra Nevada, also observed by California Department of Water Resources Snow Survey. Snowpack in the mountains of southern Nevada fell to below normal SWE due to an exceptionally dry January. Very little snow fell in the Spring Mountains in southern Nevada.
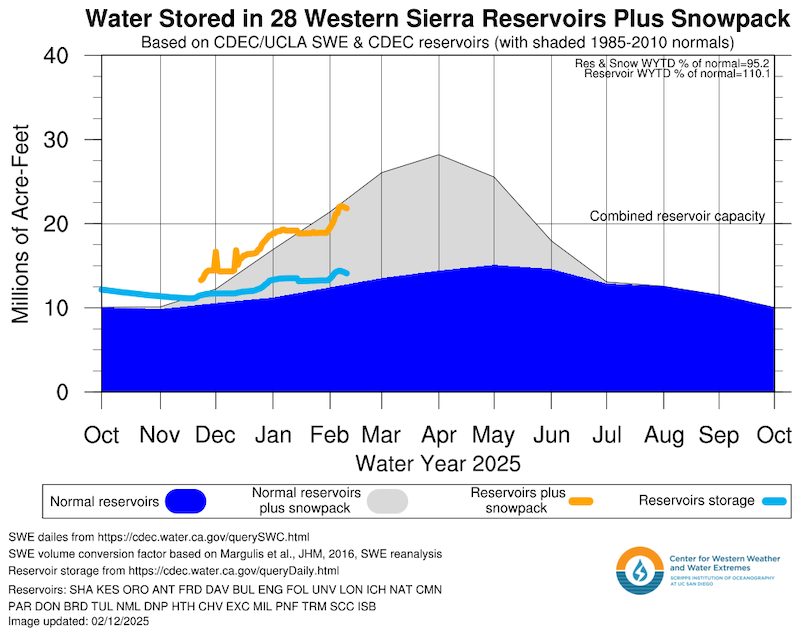
- Drought has not yet significantly impacted water supplies in California and Nevada. Major California water supply reservoirs are near or above their historical averages and reservoirs plus snowpack total is near normal for this time of year (Figure 4). However, in Nevada, reservoir storage remains at lower capacity compared to last year (see the Natural Resources Conservation Service).
- Upper Colorado River Basin precipitation and snowpack conditions are below normal. Lake Powell and Lake Mead levels are above what they were at this time last year, with Powell 35% full and Mead 34% full.
Figure 1: Water Year Precipitation Is Below Normal in Central and Southern California–Nevada
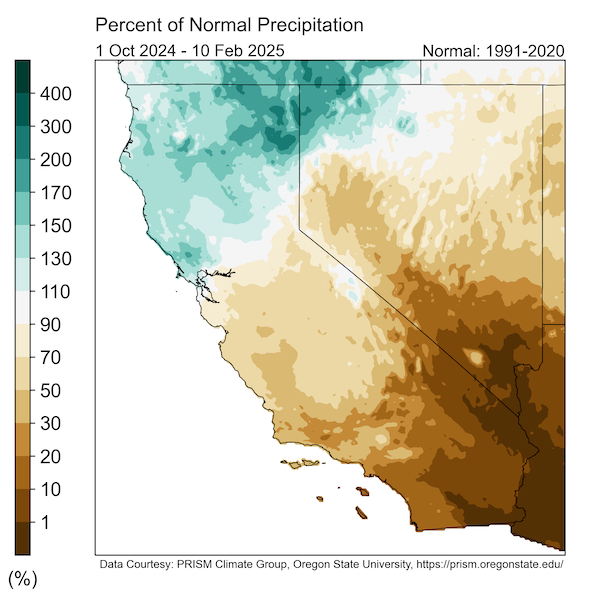
Figure 2: Early 2025 Continues Extreme Dry and Wet Divide to the Region
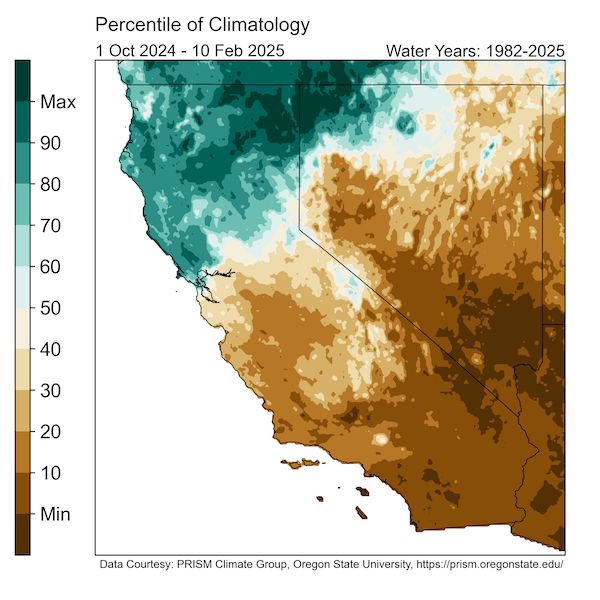
Figure 3: Stark North–South Difference in California and Nevada Snowpack
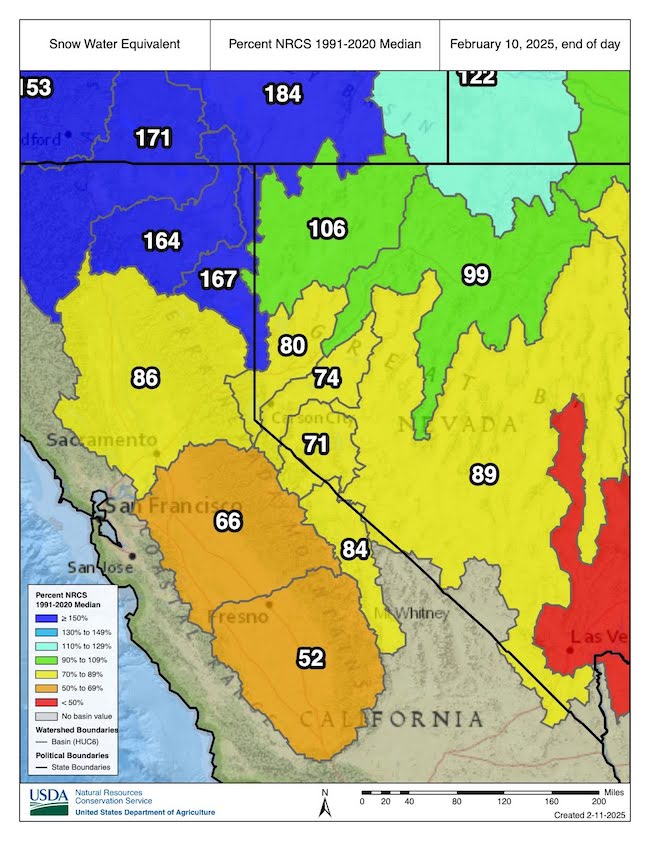
Figure 4: Water Storage Near Normal in Western Sierra Reservoirs and Snowpack
Outlooks and Forecasts for California-Nevada
- A La Niña Advisory is in place.
- La Niña conditions—which historically increase chances of normal to dry winters in southern California and Nevada—are expected to persist in the near-term (February to April 2025), with a transition to ENSO-neutral likely during March–May 2025 (66% chance).
- This week a second, stronger atmospheric river is forecast to bring heavy rain and mountain snow to much of California late Wednesday (February 12) through Friday (February 14). Storm-total precipitation amounts of 5–10 inches are possible in the Sierra Nevada, Central California Coast Ranges, and Southern California Transverse Ranges.
- NOAA’s National Weather Service Climate Prediction Center forecasts drier and warmer conditions for the latter half of February (Figure 5, 6). The weeks 3-4 outlook (February 22–March 7) and the seasonal outlook (February–April) continue to depict a similar pattern to previous months, favoring wetter/cooler conditions in the northern part of the region and warmer/drier conditions in the southern part of the region. A large portion of the region has equal chances of above-, below-, or near-normal conditions.
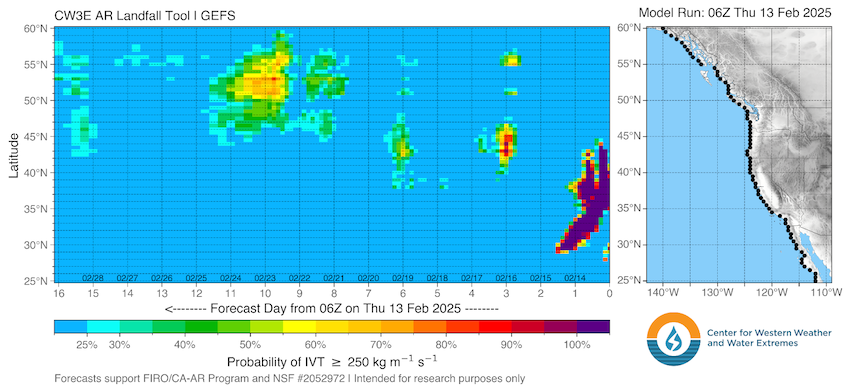
- Atmospheric river activity over California and Nevada is forecast to decrease over the next 2 weeks (Figure 7).
- Fire potential remains above normal for the southern coast of California from February through Spring.
- As of January 31, existing drought conditions are forecast to primarily persist over the next one to three months.
- Short- and long-term droughts differ in the timescales over which they occur, their impacts, and their monitoring. During this period of drought development and intensification, short-term drought impacts (e.g., impacts to rain-fed agriculture, wildfire risk, surface water reductions) will likely begin and intensify as drought conditions worsen.
Figure 5: 8–14 Day Outlook Favors Below-Normal Precipitation
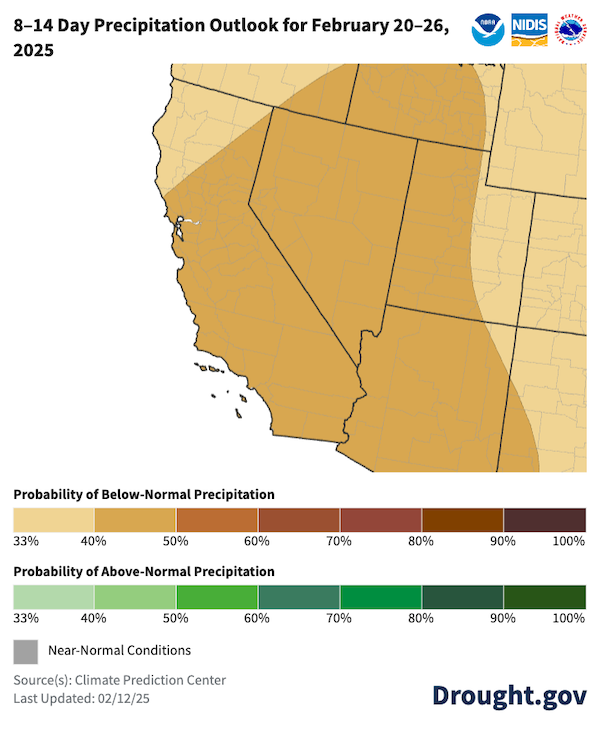
Figure 6: 8-14 Day Outlook Favors Above-Normal Temperatures
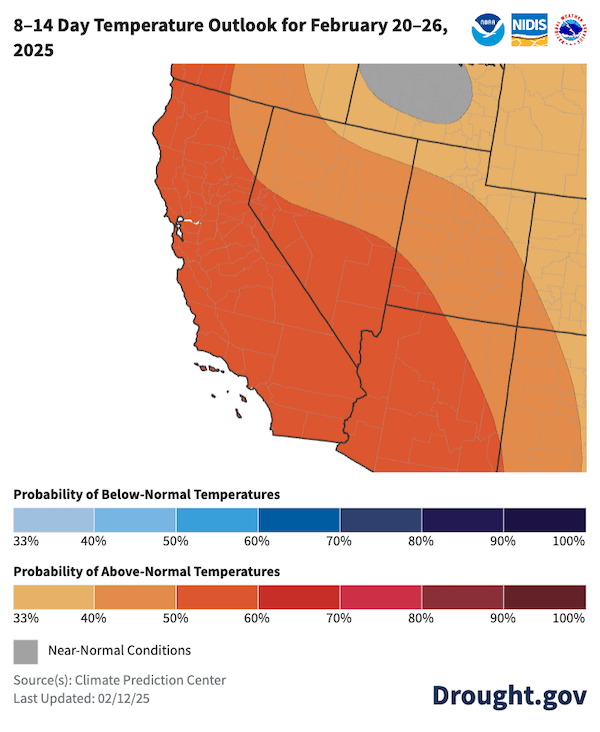
Figure 7: Atmospheric River Activity Likely to Decrease Over Drought Areas Over Next 2 Weeks
Resources
- Explore regional and state drought information:
- NIDIS and partners are piloting a series of Southern California Sector-Specific Drought Early Warning Outlooks in Water Year 2025. Learn more and get involved by contacting Amanda Sheffield (amanda.sheffield@noaa.gov).
Register for the March 24 California-Nevada Drought and Climate Outlook Webinar, which will provide an overview of climate and drought conditions, impacts, and outlooks.
Read the latest Western Regional Snow Drought Status Update.
Check local National Weather Service Drought Information Statements. These statements provide up-to-date reports on the current drought situation for regional Weather Forecast Offices' county warning and forecast area.
Prepared By
Amanda Sheffield
NOAA/NIDIS California-Nevada DEWS Regional Drought Information Coordinator, Cooperative Institute for Research in Environmental Sciences (CIRES)
Julie Kalansky
Principal Investigator California-Nevada Adaptation Program (a NOAA CAP team)
This Drought Status Update is issued in partnership between the National Oceanic and Atmospheric Administration (NOAA) and the California-Nevada Adaptation Program (a NOAA CAP team) and the Western Regional Climate Center at the Desert Research Institute to communicate a potential area of concern for drought expansion and/or development within the California-Nevada DEWS region based on recent conditions and the upcoming forecast. Thank you to our partners at California Department of Water Resources, NOAA’s National Weather Service, and Center for Western Weather and Water Extremes (CW3E) for their review. NIDIS and its partners will issue future Drought Status Updates as conditions evolve.
