Drought persists in central and southern California and Nevada.
A potentially warmer than normal spring and summer could bring impacts to spring runoff, agriculture, and wildfire risk.
Key Points
- Since the start of the water year, the area of California and Nevada in drought has increased by ~20% and intensified, including new areas of Extreme (D3) to Exceptional (D4) Drought, according to the U.S. Drought Monitor.
- A north-south gradient in drought conditions shows this water year’s drought depended on when, where, and how much precipitation was received.
- February and March storms brought some improvements to a record-setting dry start to the water year in southern California and Nevada.
- Above-normal temperatures are favored over the next two weeks, which will likely impact water resource yields from rapid snowmelt. Similar temperature trends in the Climate Prediction Center’s seasonal outlooks for April–June suggest high evaporative demand (the “thirst” of the atmosphere) over the summer, which could dry landscapes and vegetation.
- Drought impacts, such as to vegetation, agriculture, public health, and fire potential, are expected to manifest and/or continue in southern California and Nevada as we head through the likely above-normal warm season. Drought preparedness is key in parts of California and Nevada.
The U.S. Drought Monitor depicts the location and intensity of drought across the country. The map uses 5 classifications: Abnormally Dry (D0), showing areas that may be going into or are coming out of drought, and four levels of drought (D1–D4).
The U.S. Drought Monitor is a joint effort of the National Oceanic and Atmospheric Administration, U.S. Department of Agriculture, and National Drought Mitigation Center.
This water year to date U.S. Drought Monitor change map shows where drought has improved, degraded, or remained the same from October 1, 2024–April 8, 2025. Yellow shades indicate drought degradation, while green shades indicate drought improvement, according to the U.S. Drought Monitor.
This 8-week U.S. Drought Monitor change map shows where drought has improved, degraded, or remained the same from February 11–April 8, 2025. Yellow shades indicate drought degradation, while green shades indicate drought improvement, according to the U.S. Drought Monitor.
A drought index combines multiple drought indicators (e.g., precipitation, temperature, soil moisture) to depict drought conditions. For some products, like the U.S. Drought Monitor, authors combine their analysis of drought indicators with input from local observers. Other drought indices, like the Standardized Precipitation Index (SPI), use an objective calculation to describe the severity, location, timing, and/or duration of drought.
Learn MorePeriods of drought can lead to inadequate water supply, threatening the health, safety, and welfare of communities. Streamflow, groundwater, reservoir, and snowpack data are key to monitoring and forecasting water supply.
Learn MoreDrought can reduce the water availability and water quality necessary for productive farms, ranches, and grazing lands, resulting in significant negative direct and indirect economic impacts to the agricultural sector. Monitoring agricultural drought typically focuses on examining levels of precipitation, evaporative demand, soil moisture, and surface/groundwater quantity and quality.
Learn MoreA drought index combines multiple drought indicators (e.g., precipitation, temperature, soil moisture) to depict drought conditions. For some products, like the U.S. Drought Monitor, authors combine their analysis of drought indicators with input from local observers. Other drought indices, like the Standardized Precipitation Index (SPI), use an objective calculation to describe the severity, location, timing, and/or duration of drought.
Learn MorePeriods of drought can lead to inadequate water supply, threatening the health, safety, and welfare of communities. Streamflow, groundwater, reservoir, and snowpack data are key to monitoring and forecasting water supply.
Learn MoreDrought can reduce the water availability and water quality necessary for productive farms, ranches, and grazing lands, resulting in significant negative direct and indirect economic impacts to the agricultural sector. Monitoring agricultural drought typically focuses on examining levels of precipitation, evaporative demand, soil moisture, and surface/groundwater quantity and quality.
Learn MoreDrought & Dryness Categories
% AreaD0 – Abnormally Dry
Abnormally Dry (D0) indicates a region that is going into or coming out of drought.
D1 – Moderate Drought
Moderate Drought (D1) is the first of four drought categories (D1–D4), according to the U.S. Drought Monitor.
D2 – Severe Drought
Severe Drought (D2) is the second of four drought categories (D1–D4), according to the U.S. Drought Monitor.
D3 – Extreme Drought
Extreme Drought (D3) is the third of four drought categories (D1–D4), according to the U.S. Drought Monitor.
D4 – Exceptional Drought
Exceptional Drought (D4) is the most intense drought category, according to the U.S. Drought Monitor.
Total Area in Drought (D1–D4)
Percent area of the California–Nevada region that is currently in drought (D1–D4), according to the U.S. Drought Monitor.
Drought Degradation
5-Category Degradation
Drought/dryness has worsened by 5 categories, according to the U.S. Drought Monitor.
4-Category Degradation
Drought/dryness has worsened by 4 categories, according to the U.S. Drought Monitor.
3-Category Degradation
Drought/dryness has worsened by 3 categories, according to the U.S. Drought Monitor.
2-Category Degradation
Drought/dryness has worsened by 2 categories, according to the U.S. Drought Monitor.
1-Category Degradation
Drought/dryness has worsened by 1 category, according to the U.S. Drought Monitor.
Drought Improvement
1-Category Improvement
Drought/dryness has improved by 1 category, according to the U.S. Drought Monitor.
2-Category Improvement
Drought/dryness has improved by 2 categories, according to the U.S. Drought Monitor.
3-Category Improvement
Drought/dryness has improved by 3 categories, according to the U.S. Drought Monitor.
4-Category Improvement
Drought/dryness has improved by 4 categories, according to the U.S. Drought Monitor.
5-Category Improvement
Drought/dryness has improved by 5 categories, according to the U.S. Drought Monitor.
Drought Change Since Last Week
3-Category Degradation
Drought/dryness has worsened by 3 categories, according to the U.S. Drought Monitor.
2-Category Degradation
Drought/dryness has worsened by 2 categories, according to the U.S. Drought Monitor.
1-Category Degradation
Drought/dryness has worsened by 1 category, according to the U.S. Drought Monitor.
No Change
There has been no change in drought conditions at this location.
1-Category Improvement
Drought/dryness has improved by 1 category, according to the U.S. Drought Monitor.
2-Category Improvement
Drought/dryness has improved by 2 categories, according to the U.S. Drought Monitor.
3-Category Improvement
Drought/dryness has improved by 3 categories, according to the U.S. Drought Monitor.
The U.S. Drought Monitor depicts the location and intensity of drought across the country. The map uses 5 classifications: Abnormally Dry (D0), showing areas that may be going into or are coming out of drought, and four levels of drought (D1–D4).
The U.S. Drought Monitor is a joint effort of the National Oceanic and Atmospheric Administration, U.S. Department of Agriculture, and National Drought Mitigation Center.
This water year to date U.S. Drought Monitor change map shows where drought has improved, degraded, or remained the same from October 1, 2024–April 8, 2025. Yellow shades indicate drought degradation, while green shades indicate drought improvement, according to the U.S. Drought Monitor.
This 8-week U.S. Drought Monitor change map shows where drought has improved, degraded, or remained the same from February 11–April 8, 2025. Yellow shades indicate drought degradation, while green shades indicate drought improvement, according to the U.S. Drought Monitor.
This U.S. Drought Monitor is released every Thursday morning, with data valid through Tuesday at 7 a.m. ET.
This U.S. Drought Monitor (USDM) and USDM change maps are released every Thursday morning, with data valid through Tuesday at 7 a.m. ET.
This U.S. Drought Monitor (USDM) and USDM change maps are released every Thursday morning, with data valid through Tuesday at 7 a.m. ET.
A drought index combines multiple drought indicators (e.g., precipitation, temperature, soil moisture) to depict drought conditions. For some products, like the U.S. Drought Monitor, authors combine their analysis of drought indicators with input from local observers. Other drought indices, like the Standardized Precipitation Index (SPI), use an objective calculation to describe the severity, location, timing, and/or duration of drought.
Learn MorePeriods of drought can lead to inadequate water supply, threatening the health, safety, and welfare of communities. Streamflow, groundwater, reservoir, and snowpack data are key to monitoring and forecasting water supply.
Learn MoreDrought can reduce the water availability and water quality necessary for productive farms, ranches, and grazing lands, resulting in significant negative direct and indirect economic impacts to the agricultural sector. Monitoring agricultural drought typically focuses on examining levels of precipitation, evaporative demand, soil moisture, and surface/groundwater quantity and quality.
Learn MoreA drought index combines multiple drought indicators (e.g., precipitation, temperature, soil moisture) to depict drought conditions. For some products, like the U.S. Drought Monitor, authors combine their analysis of drought indicators with input from local observers. Other drought indices, like the Standardized Precipitation Index (SPI), use an objective calculation to describe the severity, location, timing, and/or duration of drought.
Learn MorePeriods of drought can lead to inadequate water supply, threatening the health, safety, and welfare of communities. Streamflow, groundwater, reservoir, and snowpack data are key to monitoring and forecasting water supply.
Learn MoreDrought can reduce the water availability and water quality necessary for productive farms, ranches, and grazing lands, resulting in significant negative direct and indirect economic impacts to the agricultural sector. Monitoring agricultural drought typically focuses on examining levels of precipitation, evaporative demand, soil moisture, and surface/groundwater quantity and quality.
Learn MoreA drought index combines multiple drought indicators (e.g., precipitation, temperature, soil moisture) to depict drought conditions. For some products, like the U.S. Drought Monitor, authors combine their analysis of drought indicators with input from local observers. Other drought indices, like the Standardized Precipitation Index (SPI), use an objective calculation to describe the severity, location, timing, and/or duration of drought.
Learn MorePeriods of drought can lead to inadequate water supply, threatening the health, safety, and welfare of communities. Streamflow, groundwater, reservoir, and snowpack data are key to monitoring and forecasting water supply.
Learn MoreDrought can reduce the water availability and water quality necessary for productive farms, ranches, and grazing lands, resulting in significant negative direct and indirect economic impacts to the agricultural sector. Monitoring agricultural drought typically focuses on examining levels of precipitation, evaporative demand, soil moisture, and surface/groundwater quantity and quality.
Learn MoreThis update is based on data available as of Thursday, April 10, 2025 at 7:00 a.m. PT. We acknowledge that conditions are evolving.
Current Drought Conditions for California/Nevada
- Over the last 4-8 weeks, according to the U.S. Drought Monitor, drought and Abnormally Dry (D0) conditions have improved slightly in California and Nevada, though less so in the most drought intense areas. The water year overall has seen 1-4 class degradations in central to southern California and Nevada.
- Northern California and northwestern Nevada continued to receive above-normal precipitation, while the central and southern portions of the region received below- to well-below-normal precipitation for the water year to date (Figure 1).
- Below-normal temperatures and higher than normal precipitation during March helped mitigate drought in the Central Valley, San Diego, and eastern Great Basin regions (Figure 2).
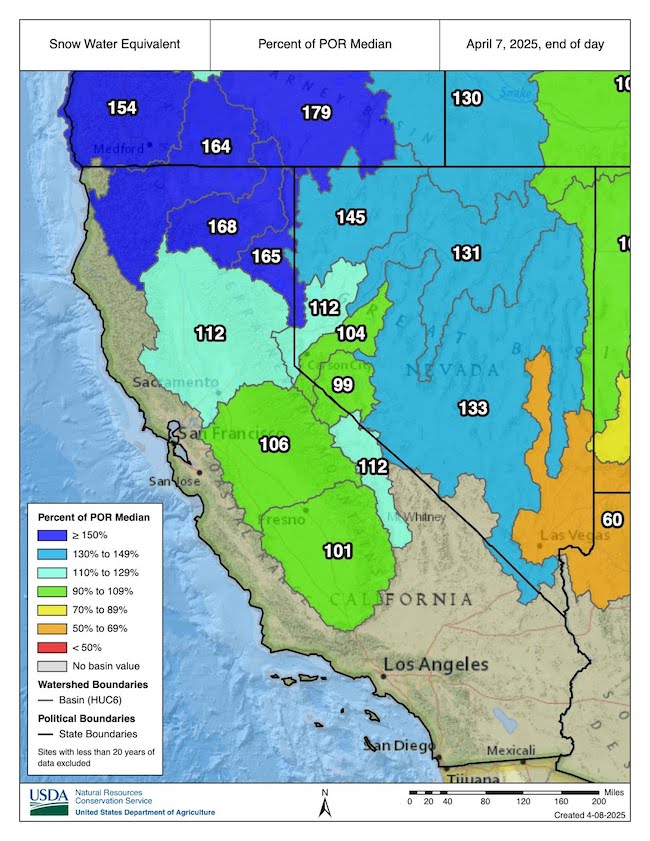
- Since mid-February, snow water equivalent (SWE, Figure 3) has increased to near-normal conditions in the southern and central Sierras. According to this month’s western snow drought update, some basins in the Sierra Nevada have near to above median SWE (such as north of I-80), but there is regional disparity in conditions. In the Spring Mountains in southern Nevada, no snowpack remains, and SWE peaked well below median. Snowmelt was more than two weeks early in some locations.
- Major California water supply reservoirs are near or above their historical averages, and total water supply from reservoirs plus snowpack is near normal for this time of year. State Water Project allocations were increased to 40% of requested water supplies, and Central Valley Project water supply allocations were increased for south-of-Delta and Friant Division contractors.
- In Nevada, SWE peaked above median in the Humboldt, Owyhee, Snake, and Clover-Franklin Basins, as well as in the Northern Great Basin. However, reservoir storage remains at lower capacity compared to last year except in the Humboldt Basin.
- Upper Colorado River Basin precipitation and snowpack conditions are below normal. Combined storage in Lake Powell and Lake Mead is down 691,000 acre-feet from this time last year, with storage at 33% of capacity.
Figure 1: Water Year Precipitation Is Below Normal in Central and Southern California–Nevada
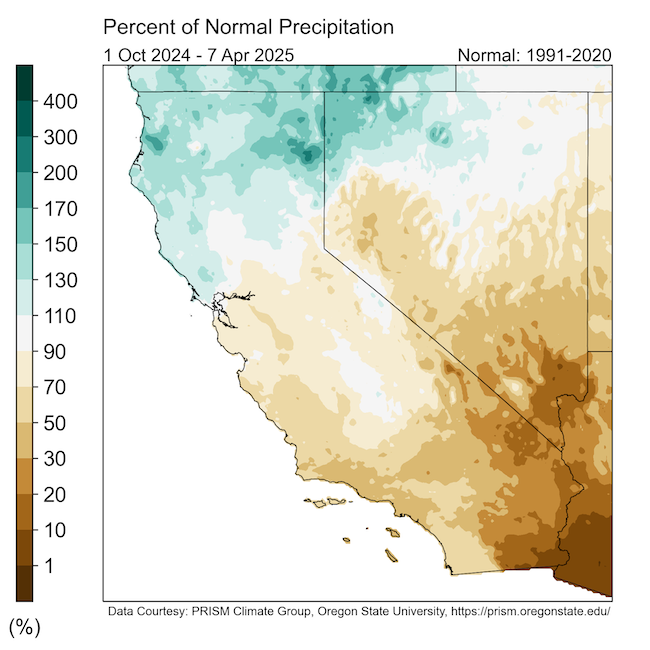
Figure 2: Above-Normal March Precipitation Slightly Relieves Drought
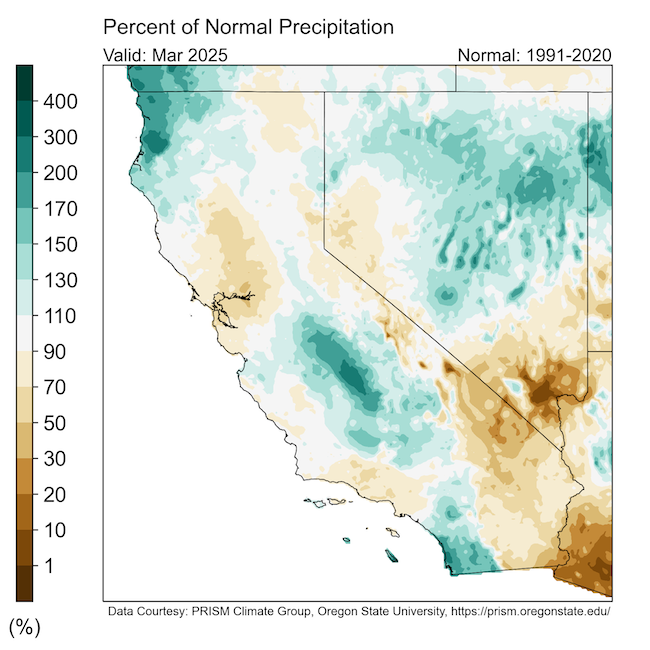
Figure 3: Central and Southern Sierra Nevada Snowpack Recovers
Outlooks and Potential Impacts for California-Nevada
- National Weather Service forecasts favor a warming and drying trend this week and into the coming weeks (Figure 4), which could accelerate snowmelt. This trend of warmer conditions is forecasted to continue over the next 3 months, with the potential to impact water resource yields from rapid snowmelt (Figure 5).
- Little atmospheric river activity is forecast over California and Nevada over the next two weeks. This shift to drier conditions, including over drought areas in southern California, signals the end of the winter wet season.
- Existing drought conditions are primarily forecast to persist over the next one to three months.
- The rate of snowmelt and possible above-average spring temperatures will need to be watched, especially in places with near-normal or below-normal snowpack (e.g., the central and southern Sierras). According to the California Nevada River Forecast Center, the northern Sierras are forecast to have near-normal runoff for the water year. Southern and eastern Sierra runoff forecasts range between normal and 70% of normal.
- Seasonal forecasts of high evaporative demand over the summer could dry landscapes and vegetation. The U.S. Department of Agriculture (USDA) has expanded its drought disaster designations to fast track Lincoln County, Nevada as a natural disaster area due to drought. Drought impacts are expected to manifest and continue in the southern parts of California and Nevada as we head through the warm season.
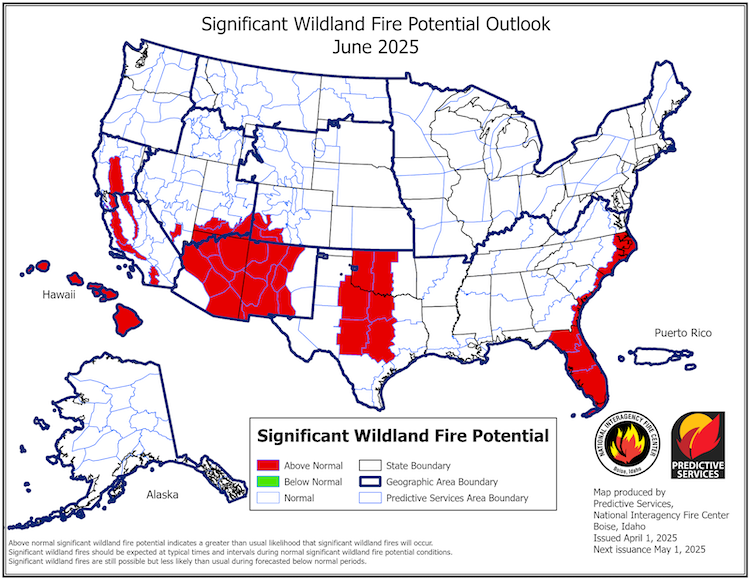
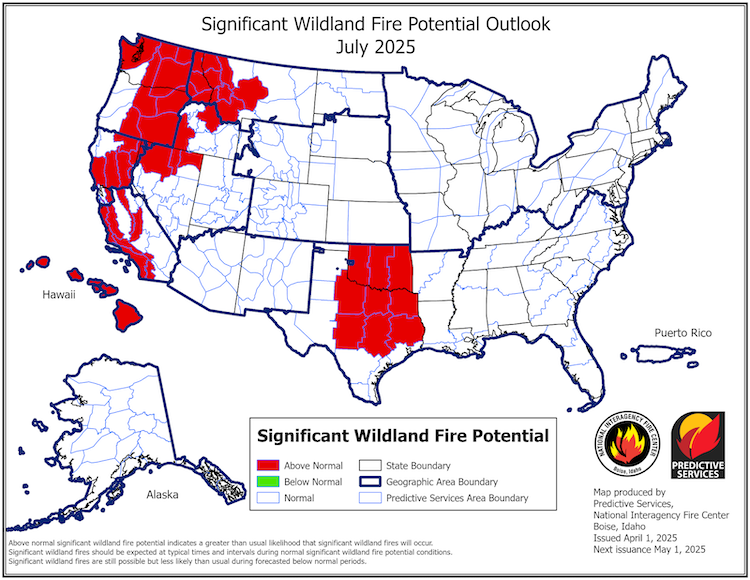
- The National Interagency Fire Center predicts above-normal fire potential in the southwestern U.S., as well as southern California and southern Nevada in June (Figure 6). Significant fire potential will return to normal in the Four Corners and southern Nevada in July due to the monsoon, but above-normal fire potential will expand into more of California and the northern Great Basin.
- Given drought conditions and the drier and warmer forecast, an outlook provided by NOAA and partners as part of a pilot in Southern California to improve early warning of drought impacts suggests potential drought impacts to public health, agriculture, and water supplies through the summer.
Figure 4: Short-Term Outlooks Favor Above-Normal Temperatures
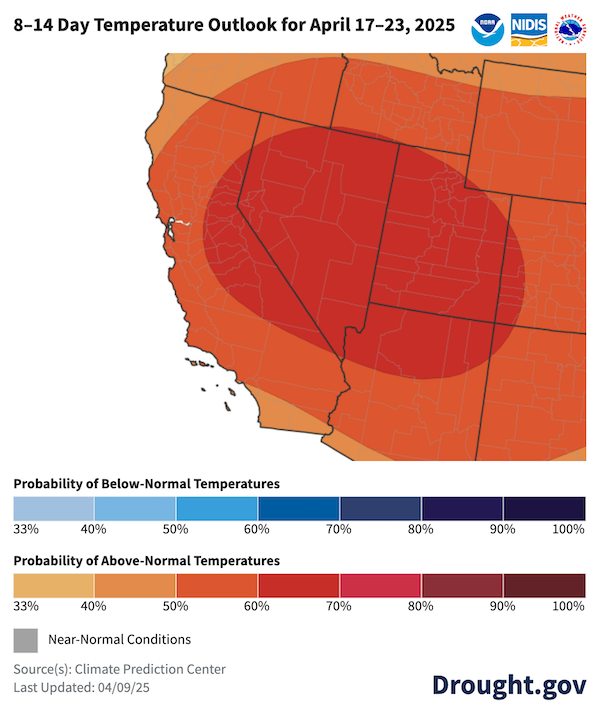
Figure 5: Seasonal (April-June) Outlooks Favor Above-Normal Temperatures
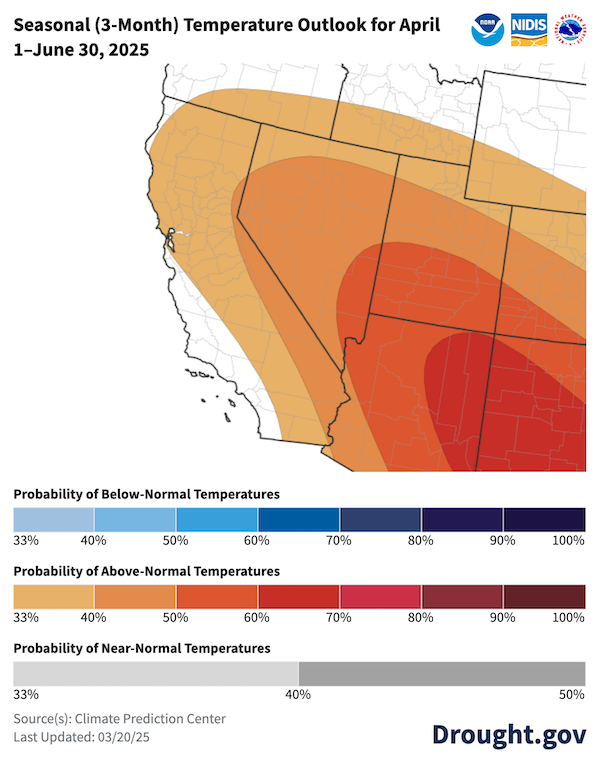
Figure 6: Significant Wildland Fire Potential Increases and Shifts in June and July
Resources
- Explore regional and state drought information:
- NIDIS and partners are piloting a series of Southern California Sector-Specific Drought Early Warning Outlooks in Water Year 2025. Learn more and get involved by contacting Amanda Sheffield (amanda.sheffield@noaa.gov).
Register for the June 2 California-Nevada Drought and Climate Outlook Webinar, which will provide an overview of climate and drought conditions, impacts, and outlooks (including fire).
Read the latest Western Regional Snow Drought Status Update.
Check local National Weather Service Drought Information Statements. These statements provide up-to-date reports on the current drought situation for regional Weather Forecast Offices' county warning and forecast area:
Los Angeles/Oxnard Weather Forecast Office: April 3 Update
San Diego Weather Forecast Office: April 1 Update
Las Vegas Weather Forecast Office: March 22 Update
Prepared By
Amanda Sheffield
California-Nevada DEWS Regional Drought Information Coordinator
Cooperative Institute for Research in Environmental Sciences (CIRES), University of Colorado Boulder
NOAA’s National Integrated Drought Information System
Julie Kalansky
Principal Investigator
California-Nevada Adaptation Program (a NOAA CAP/RISA team)
This Drought Status Update is issued in partnership between the National Oceanic and Atmospheric Administration (NOAA) and the California-Nevada Adaptation Program (a NOAA CAP team) and the Western Regional Climate Center at the Desert Research Institute to communicate a potential area of concern for drought expansion and/or development within the California-Nevada DEWS region based on recent conditions and the upcoming forecast. Thank you to our partners at California Department of Water Resources, NOAA’s National Weather Service, and Center for Western Weather and Water Extremes (CW3E) for their review. NIDIS and its partners will issue future Drought Status Updates as conditions evolve.
