Drought intensifies across Oklahoma. Late September rain brings little relief.
Key Points
- Drought continued to expand across Oklahoma, with the amount of the state in drought and in Severe Drought (D2) expanding significantly since early summer.
- In September, Extreme Drought (D3) developed over southwest Oklahoma and parts of adjacent northwest Texas. Showers in late September did little to improve drought conditions.
- NOAA’s Climate Prediction Center’s outlook predicts increased chances for warmer and drier than normal through the end of the year.
- A warmer- and drier-than-average winter (December–February) is expected for Texas and Oklahoma.
The U.S. Drought Monitor depicts the location and intensity of drought across the country. The map uses 5 classifications: Abnormally Dry (D0), showing areas that may be going into or are coming out of drought, and four levels of drought (D1–D4).
Key Takeaway: Moderate to Extreme Drought (D1–D3) persists over western Oklahoma, and Texas, with continued Extreme to Exceptional Drought (D3–D4) over Far West Texas.
The U.S. Drought Monitor depicts the location and intensity of drought across the country.
This historical time series shows the progression of drought and dryness across Kansas, Texas, and Oklahoma from 2000 to the present, as a percent of total land area.
A drought index combines multiple drought indicators (e.g., precipitation, temperature, soil moisture) to depict drought conditions. For some products, like the U.S. Drought Monitor, authors combine their analysis of drought indicators with input from local observers. Other drought indices, like the Standardized Precipitation Index (SPI), use an objective calculation to describe the severity, location, timing, and/or duration of drought.
Learn MorePeriods of drought can lead to inadequate water supply, threatening the health, safety, and welfare of communities. Streamflow, groundwater, reservoir, and snowpack data are key to monitoring and forecasting water supply.
Learn MoreDrought can reduce the water availability and water quality necessary for productive farms, ranches, and grazing lands, resulting in significant negative direct and indirect economic impacts to the agricultural sector. Monitoring agricultural drought typically focuses on examining levels of precipitation, evaporative demand, soil moisture, and surface/groundwater quantity and quality.
Learn MoreA drought index combines multiple drought indicators (e.g., precipitation, temperature, soil moisture) to depict drought conditions. For some products, like the U.S. Drought Monitor, authors combine their analysis of drought indicators with input from local observers. Other drought indices, like the Standardized Precipitation Index (SPI), use an objective calculation to describe the severity, location, timing, and/or duration of drought.
Learn MorePeriods of drought can lead to inadequate water supply, threatening the health, safety, and welfare of communities. Streamflow, groundwater, reservoir, and snowpack data are key to monitoring and forecasting water supply.
Learn MoreDrought can reduce the water availability and water quality necessary for productive farms, ranches, and grazing lands, resulting in significant negative direct and indirect economic impacts to the agricultural sector. Monitoring agricultural drought typically focuses on examining levels of precipitation, evaporative demand, soil moisture, and surface/groundwater quantity and quality.
Learn MoreU.S. Drought Monitor Categories
Abnormally Dry (D0)
Abnormally Dry (D0) indicates a region that is going into or coming out of drought. View typical impacts by state.
Moderate Drought (D1)
Moderate Drought (D1) is the first of four drought categories (D1–D4), according to the U.S. Drought Monitor. View typical impacts by state.
Severe Drought (D2)
Severe Drought (D2) is the second of four drought categories (D1–D4), according to the U.S. Drought Monitor. View typical impacts by state.
Extreme Drought (D3)
Extreme Drought (D3) is the third of four drought categories (D1–D4), according to the U.S. Drought Monitor. View typical impacts by state.
Exceptional Drought (D4)
Exceptional Drought (D4) is the most intense drought category, according to the U.S. Drought Monitor. View typical impacts by state.
Total Area in Drought (D1–D4)
Percent area of the Southern Plains that is currently in drought (D1–D4), according to the U.S. Drought Monitor.
U.S. Drought Monitor
D0 - Abnormally Dry
Abnormally Dry (D0) indicates a region that is going into or coming out of drought, according to the U.S. Drought Monitor. View typical impacts by state.
D1 – Moderate Drought
Moderate Drought (D1) is the first of four drought categories (D1–D4), according to the U.S. Drought Monitor. View typical impacts by state.
D2 – Severe Drought
Severe Drought (D2) is the second of four drought categories (D1–D4), according to the U.S. Drought Monitor. View typical impacts by state.
D3 – Extreme Drought
Extreme Drought (D3) is the third of four drought categories (D1–D4), according to the U.S. Drought Monitor. View typical impacts by state.
D4 – Exceptional Drought
Exceptional Drought (D4) is the most intense drought category, according to the U.S. Drought Monitor. View typical impacts by state.
The U.S. Drought Monitor depicts the location and intensity of drought across the country. The map uses 5 classifications: Abnormally Dry (D0), showing areas that may be going into or are coming out of drought, and four levels of drought (D1–D4).
Key Takeaway: Moderate to Extreme Drought (D1–D3) persists over western Oklahoma, and Texas, with continued Extreme to Exceptional Drought (D3–D4) over Far West Texas.
The U.S. Drought Monitor depicts the location and intensity of drought across the country.
This historical time series shows the progression of drought and dryness across Kansas, Texas, and Oklahoma from 2000 to the present, as a percent of total land area.
The U.S. Drought Monitor is updated weekly on Thursday mornings, with data valid through the previous Tuesday at 7 a.m. ET.
The U.S. Drought Monitor is updated weekly on Thursday mornings, with data valid through the previous Tuesday at 7 a.m. ET.
A drought index combines multiple drought indicators (e.g., precipitation, temperature, soil moisture) to depict drought conditions. For some products, like the U.S. Drought Monitor, authors combine their analysis of drought indicators with input from local observers. Other drought indices, like the Standardized Precipitation Index (SPI), use an objective calculation to describe the severity, location, timing, and/or duration of drought.
Learn MorePeriods of drought can lead to inadequate water supply, threatening the health, safety, and welfare of communities. Streamflow, groundwater, reservoir, and snowpack data are key to monitoring and forecasting water supply.
Learn MoreDrought can reduce the water availability and water quality necessary for productive farms, ranches, and grazing lands, resulting in significant negative direct and indirect economic impacts to the agricultural sector. Monitoring agricultural drought typically focuses on examining levels of precipitation, evaporative demand, soil moisture, and surface/groundwater quantity and quality.
Learn MoreA drought index combines multiple drought indicators (e.g., precipitation, temperature, soil moisture) to depict drought conditions. For some products, like the U.S. Drought Monitor, authors combine their analysis of drought indicators with input from local observers. Other drought indices, like the Standardized Precipitation Index (SPI), use an objective calculation to describe the severity, location, timing, and/or duration of drought.
Learn MorePeriods of drought can lead to inadequate water supply, threatening the health, safety, and welfare of communities. Streamflow, groundwater, reservoir, and snowpack data are key to monitoring and forecasting water supply.
Learn MoreDrought can reduce the water availability and water quality necessary for productive farms, ranches, and grazing lands, resulting in significant negative direct and indirect economic impacts to the agricultural sector. Monitoring agricultural drought typically focuses on examining levels of precipitation, evaporative demand, soil moisture, and surface/groundwater quantity and quality.
Learn MoreCurrent Conditions for the Southern Plains
- Wrapping up a very hot summer (June, July, August) for the Southern Plains:
- Texas:
- Texas tied its 6th warmest summer on record (since 1895), with mean daily temperatures 2.0ºF above the 1991–2020 average.
- State-averaged minimum temperatures for Texas ranked 4th warmest for June through August. This included a tie for the warmest June minimums on record, a near-normal July, and a tie for the 3rd warmest August.
- In Texas, state-averaged mean daily maximum temperatures were much above average for summer, but not near a new record for the state.
- Oklahoma:
- Summer temperatures were generally above average for Oklahoma, but not near a new record for the state. State-averaged minimum temperatures were 1.5°F above average, and maximum temperatures were 1.9°F above average.
- Kansas:
- Summer temperatures were generally above average for Kansas, but not near a new record for the state. State-averaged minimum temperatures were 0.7°F above average, and maximum temperatures were 1.0°F above average.
- Texas:
- Warm and dry conditions continued through September.
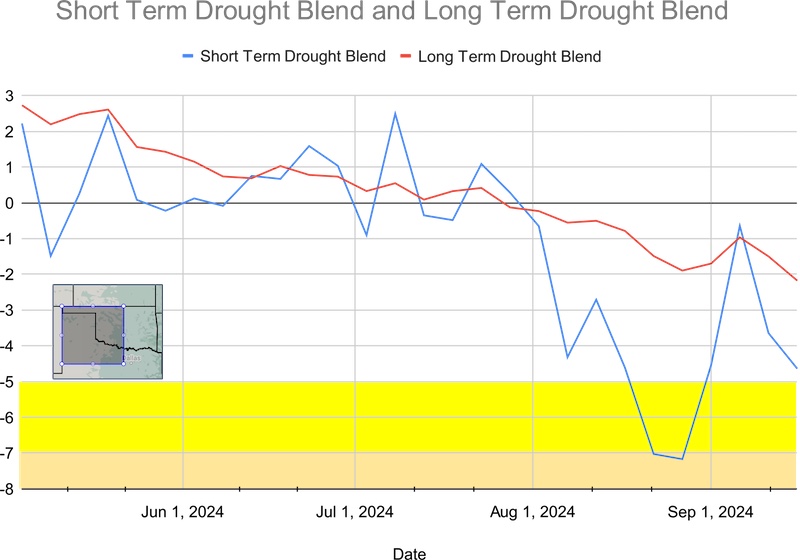
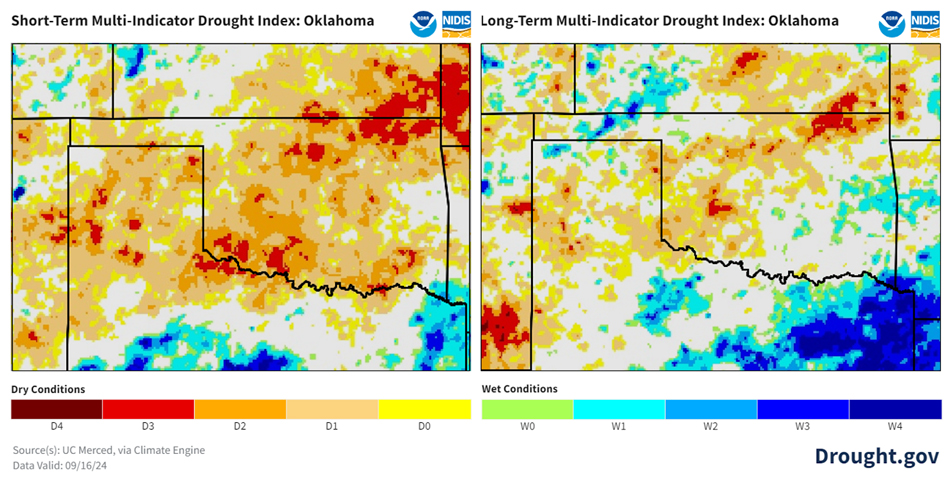
Short-Term Drought vs. Long-Term Drought in Western Oklahoma/Texas Panhandle
Key Takeaway: For western Oklahoma and the Texas Panhandle, short-term drought indicators (less than 6 months) show large swings down and up over the summer months. Long-term drought indicators (longer than 6 months) show a steady decline. This can be seen in the time series of the Multi-Indicator Drought Index. The time series displays the changes in the short-term drought indicator blend and the long-term drought indicator blend since May 1, 2024. The maps show a snapshot of both time periods from September 16, 2024. Note that the long-term drought is more severe in southwest Oklahoma than in other parts of the region.
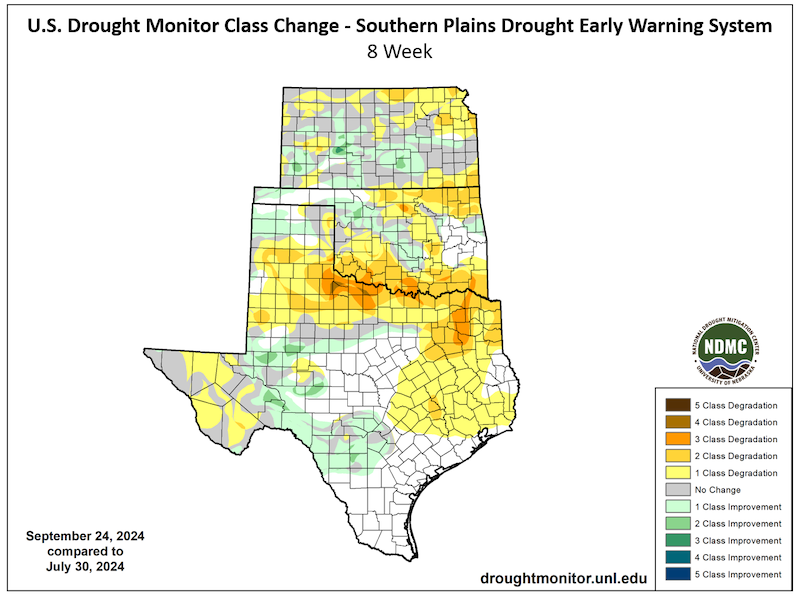
2-Month U.S. Drought Monitor Change Map (Since July 30, 2024)
Key Takeaway: Over the 8 weeks from July 30 to September 24, drought conditions worsened along a wide swath on both sides of the Red River in Texas and Oklahoma. Parts of Kansas saw some moderate improvement, while northern Kansas saw some new drought development. Far West Texas continued to be in drought with some intensification of drought over the past 8 weeks.
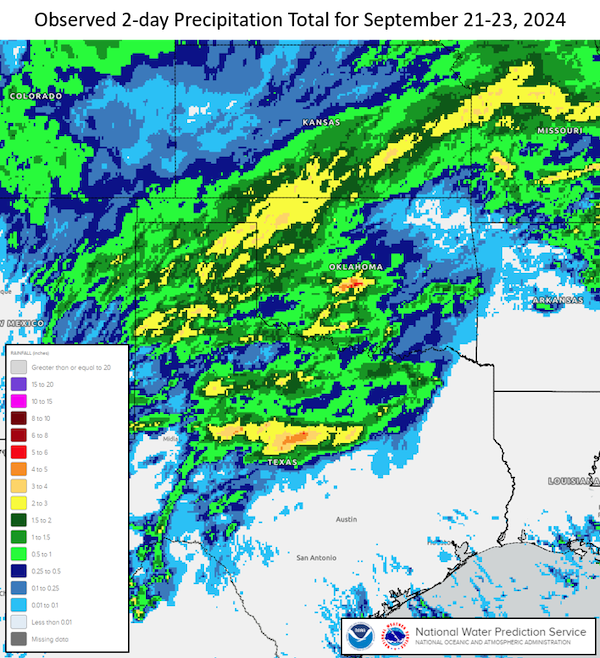
September 21–23 Rainfall's Impact on 30-Day Percent of Normal Precipitation
Key Takeaway: Oklahoma was extremely dry for most of September. From September 21–23, 2024, a cold front brought much-needed rain to the region, ranging from 1 to 4 inches for western Oklahoma. Even with this rain, most of Oklahoma still has a precipitation deficit for the month. The highest totals were in McLain and Cleveland counties, Oklahoma, where the 2-day total exceeded 4 inches and brought the 3-day precipitation total back to near-average for this time of year.
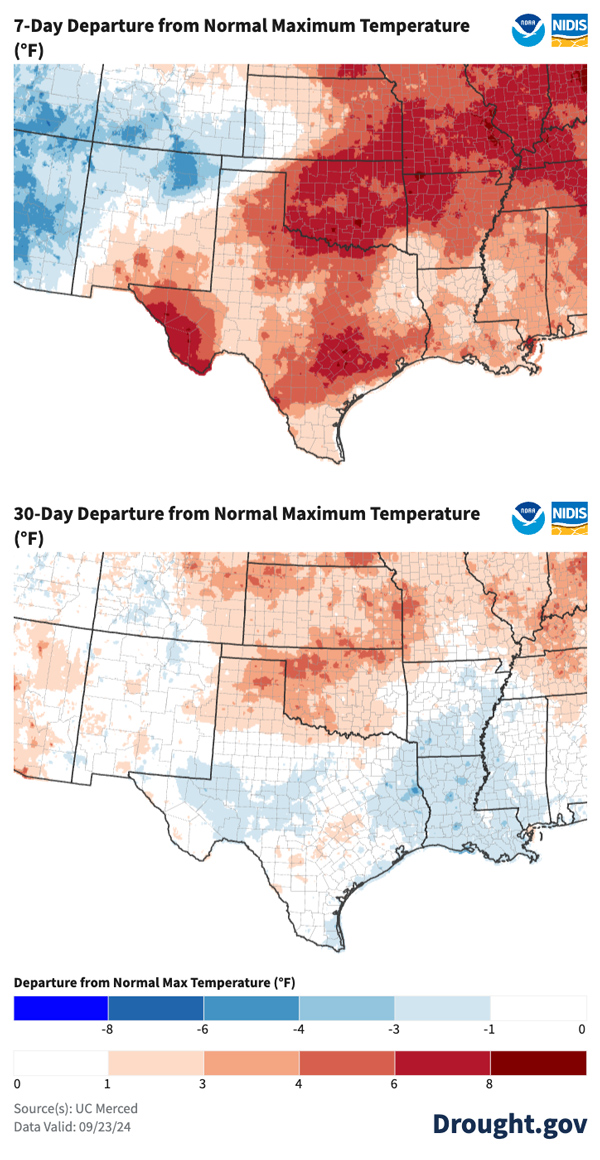
Departure from Normal Maximum Temperature: Last 7 Days and 30 Days
Key Takeaway: Late August and early September were warm compared to the long-term average across eastern Texas. This was partially driven by a very warm week from September 13–20 when temperatures across Kansas, Oklahoma, and most of northern Texas were more than 6°F above the 1991–2020 average.
Southern Plains Drought Impacts
- The Kansas corn harvest is smaller than expected due to ongoing drought. Many farmers did not plant soybeans this year due to low spring precipitation.
- Kansas corn producers experienced not just low rainfall, but high temperatures are also impacting corn harvest in Kansas.
- Wichita, Kansas, extended stage 2 of water restrictions due to drought through September. The city warned of stage 3 water restrictions if Cheney Reservoir levels continue to fall.
- Some areas of Oklahoma are 6–8 inches below their normal rainfall amounts for the last 90 days.
- Drought improved in the Texas Hill Country.
- No cotton irrigation from Lake Altus-Lugert was allowed for the third consecutive year due to low reservoir levels (source: Farm Credit of Western Oklahoma).
- Oklahoma led the region on September 22 with statewide topsoil moisture rated 57% very short to short, followed by Texas at 49%. Meanwhile, one-half (50%) of the rangeland and pastures were rated in very poor to poor condition in Texas. Texas also led the U.S. with 48% of its cotton rated in very poor to poor condition on that date, well above the national value of 33%.
Report your local drought impacts through a Condition Monitoring Observer Report:
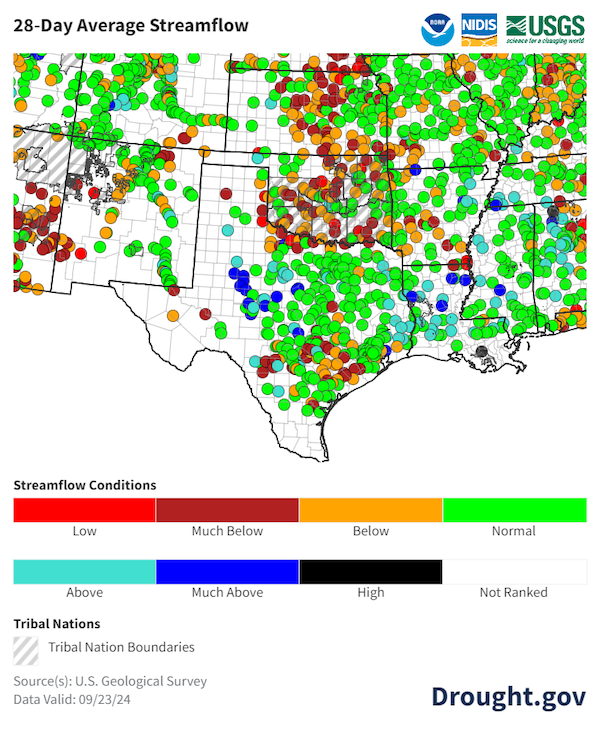
28-Day Average Streamflow Conditions (Valid September 23, 2024)
Key Takeaway: Meteorological drought across Oklahoma and central Kansas, which has lasted over a year, reduced streamflow and led to hydrologic drought conditions, with the most severe conditions in central Oklahoma.
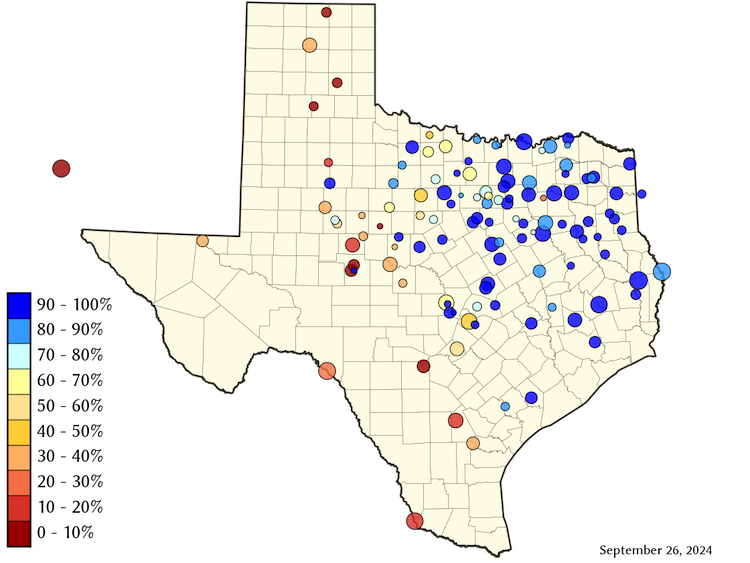
Texas Reservoir Levels
Key Takeaway: Reservoir levels in eastern Texas showed continued improvement, while reservoir levels in central and southern Texas remained low. A few notable reservoirs in drought status as of September 26 are:
- Elephant Butte, New Mexico, Rio Grande: 6.1% full
- Falcon Reservoir, Rio Grande: 14.0% full
- Amistad Reservoir, Rio Grande: 27.1% full (lowest ever for this time of year)
- Medina Lake, Medina River: 3.1% full (lowest ever for this time of year)
- Twin Buttes Reservoir, Middle and South Concho Rivers: 9.8% full
- Choke Canyon Reservoir, 19.2% full (all-time lowest)
- Canyon Lake, 55.1% full (lowest ever for this time of year)
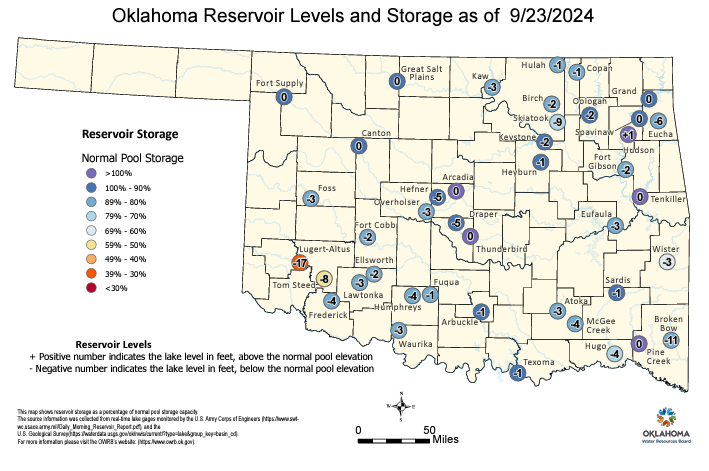
Oklahoma Reservoir Levels
Key Takeaway: Most reservoirs in northeastern Oklahoma are generally near-normal for this time of year, while most reservoirs in the far southwestern part of the state are less than 80% of normal. Lake Altus-Lugert is 17 feet below normal pool elevation and less than 50% of normal pool storage.
Outlooks and Potential Impacts for the Southern Plains
- The Southern Plains usually receives less precipitation in autumn and winter than it does in the summer months.
- When averaged across the region, this usually works out to be a bit more than 7 inches over these three months.
- The highest October to December averages are along the Gulf Coast east of Houston (greater than 16 inches), with the lowest averages (less than 2 inches) in western Texas near El Paso and Big Bend National Park.
- The NOAA Climate Prediction Center’s latest monthly and seasonal climate outlooks show increased probabilities for a hotter and drier end to 2024 when compared to normal.
- The El Niño–Southern Oscillation (ENSO) is currently neutral. A La Niña watch is in place.
- ENSO-neutral means neither El Niño nor La Niña is driving current weather patterns.
- A La Niña pattern is likely to develop in September–November (71% chance) and will likely last through January–March 2025. The odds of a La Niña have decreased over the past months.
- La Niña usually, but not always, leads to a warmer and drier winter for Texas and Oklahoma with a weaker influence in Kansas.
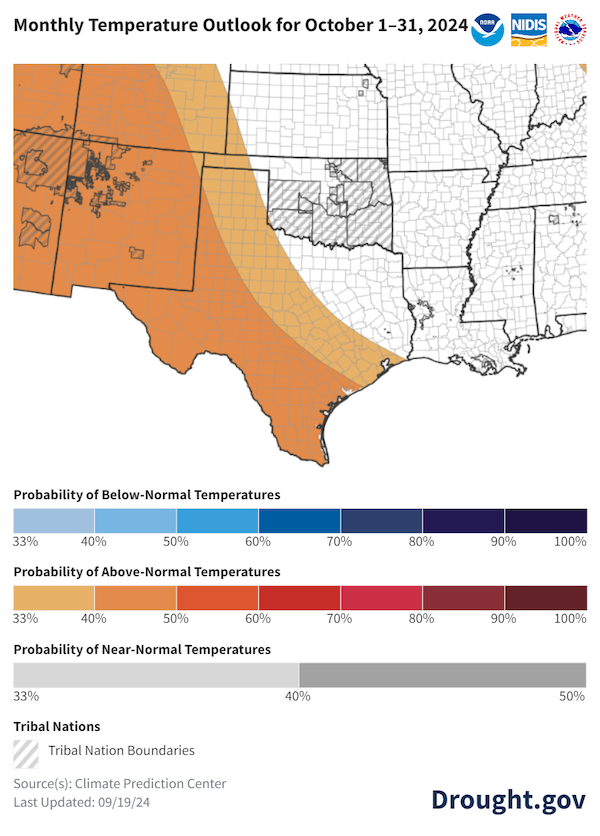
October 2024 Temperature Outlook
Key Takeaway: Odds slightly favor above-normal temperatures for most of southern and eastern Texas for October, with near equal odds of above-, near-, or below-normal temperatures for most of Oklahoma and Kansas.
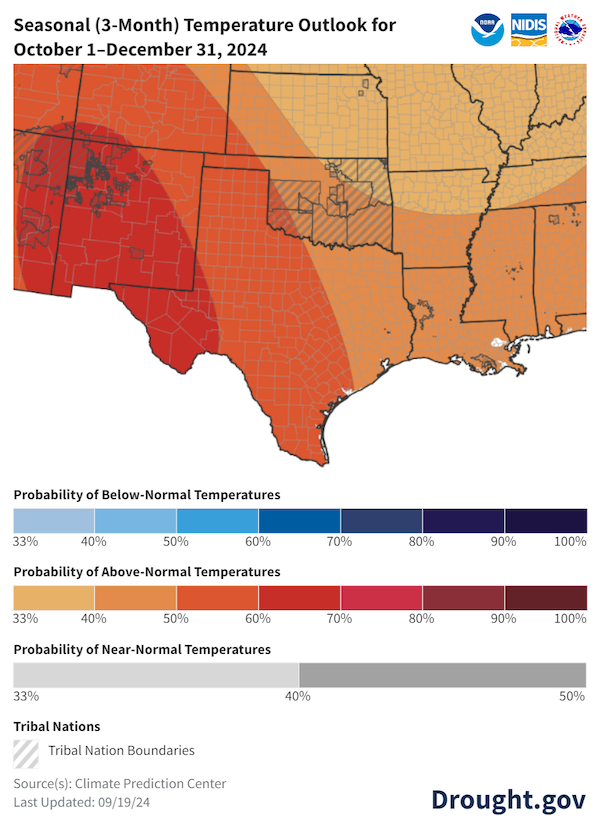
Seasonal (3-Month) Temperature Outlook: October–December 2024
Key Takeaway: The last three months of this year are likely to be warmer than normal. The highest odds for October–December are for Far West Texas where there is a 60%–70% chance of above-normal temperatures. The odds decline toward the northeast such that most of eastern Kansas has only a 33%–40% chance of exceeding normal temperatures for the season.
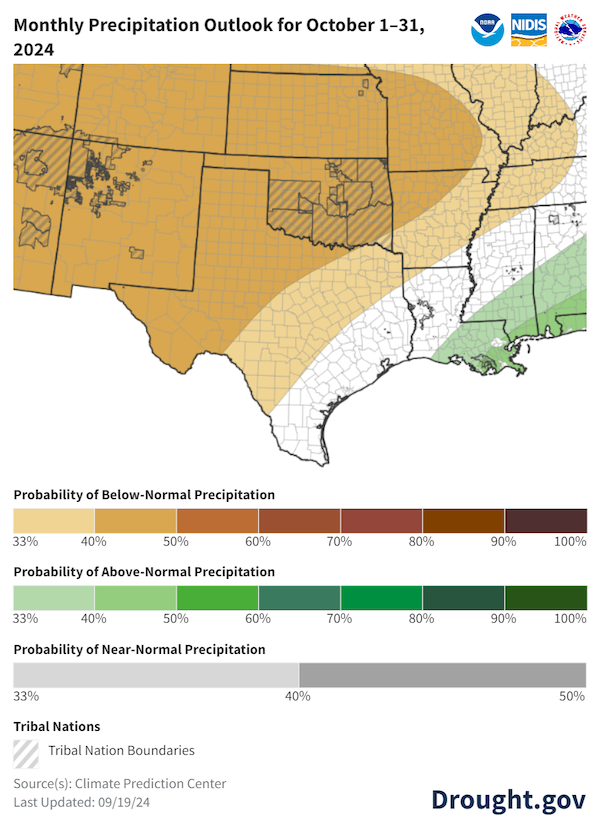
October 2024 Precipitation Outlook
Key Takeaway: In October, the outlooks slightly favor (33%–50% chance) below-normal precipitation for Kansas, Oklahoma, and northwestern Texas. There are equal chances for above-, near-, or below-normal precipitation for the Gulf Coast region.
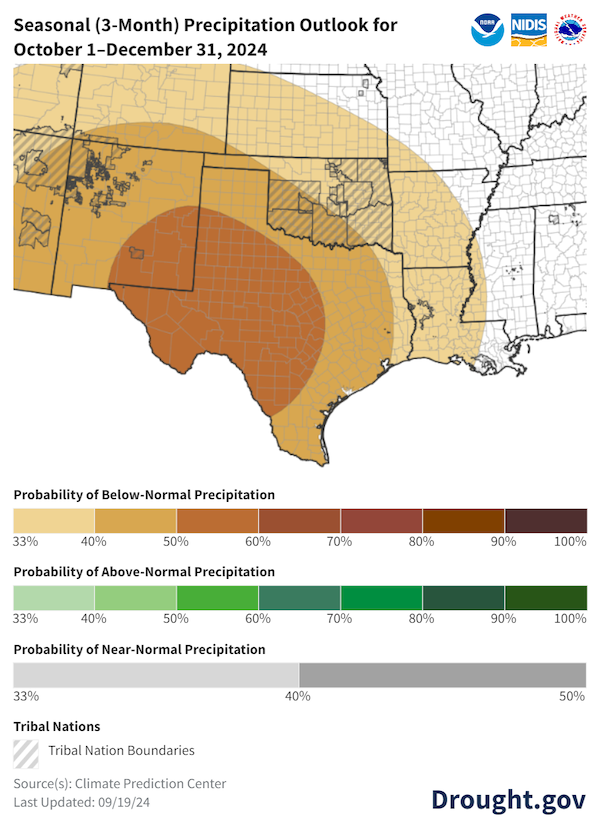
Seasonal (3-Month) Precipitation Outlook: October–December 2024
Key Takeaway: The latest seasonal precipitation outlook for October–December slightly favors lower-than-normal precipitation for Kansas and northeast Oklahoma, with odds increasing to 40%–50% for the panhandle regions, southwest Oklahoma, and eastern Texas. Odds for a dry end to the year increase to 50%–60% for western Texas.
Southern Plains Drought Resources
Regional Resources
- Southern Regional Climate Center
- Water Data for Texas
- Oklahoma Mesonet
- National Weather Service Drought Information Statements
- Explore state drought information on Drought.gov:
Prepared By
Joel Lisonbee, Adam Lang, Kelsey Satalino, and Eleanor Hasenbeck
Cooperative Institute for Research in Environmental Sciences/University of Colorado, Boulder and NOAA’s National Integrated Drought Information System, Southern Plains Drought Early Warning System
Gary McManus
Oklahoma State Climatologist, Oklahoma Mesonet, Oklahoma Climatological Survey
John Nielsen-Gammon
Texas State Climatologist, Texas State Climate Office, Texas A&M University
Southern Regional Climate Center
William (BJ) Baule
Texas State Climate Office, Texas A&M University
Southern Regional Climate Center
Victor Murphy
National Weather Service
This Drought Status Update is issued in partnership between the National Oceanic and Atmospheric Administration (NOAA) and the State Climate Offices in Kansas, Oklahoma and Texas to communicate a potential area of concern for drought expansion and/or development within the Southern Plains region based on recent conditions and the upcoming forecast. NIDIS and its partners will issue future Drought Status Updates as conditions evolve.
