National Weather Service (NWS)
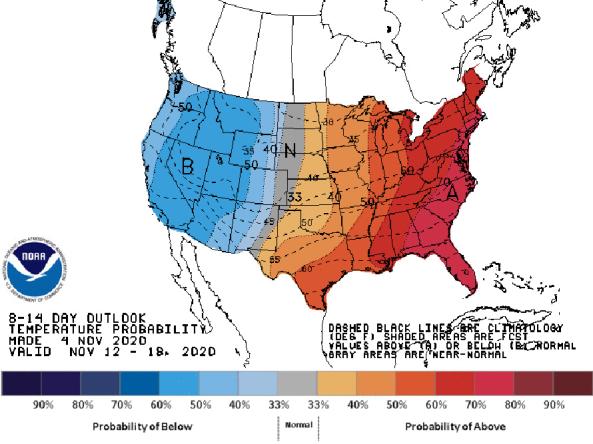
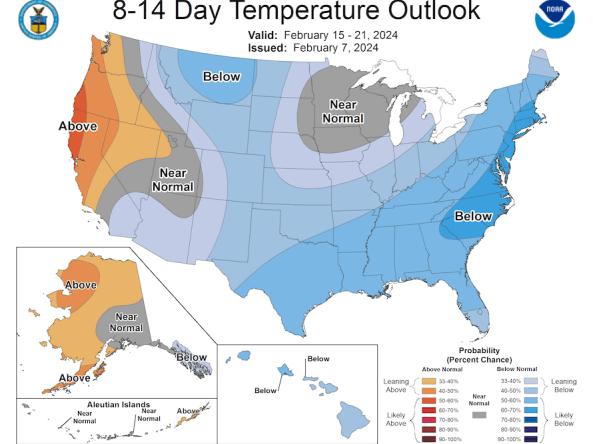
National Weather Service (NWS) Climate Prediction Center (CPC) generates outlooks that view probabilities of above- or below-normal temperature and precipitation maps at the 6-10 Day, 8-14 Day, Wee
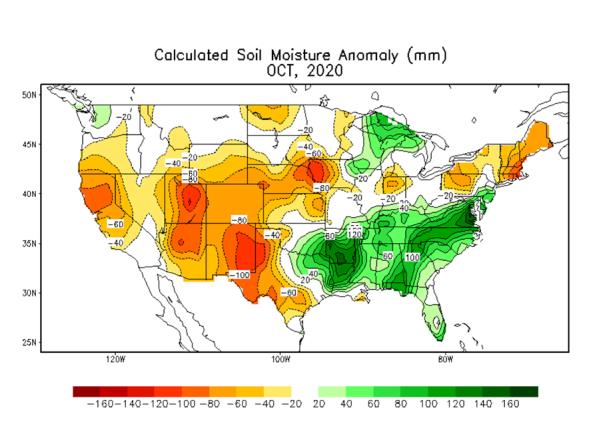
Soil moisture conditions at the daily and monthly scales depicting total soil moisture, percentiles and anomalies, as well as monthly and seasonal change.
The Climate Prediction Center (CPC) produces temperature and precipitation outlooks for the U.S., including 6-10 day, 8-14 day, monthly, and seasonal outlooks.
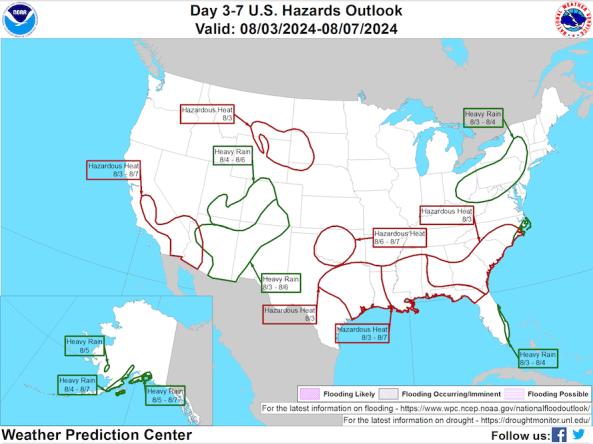
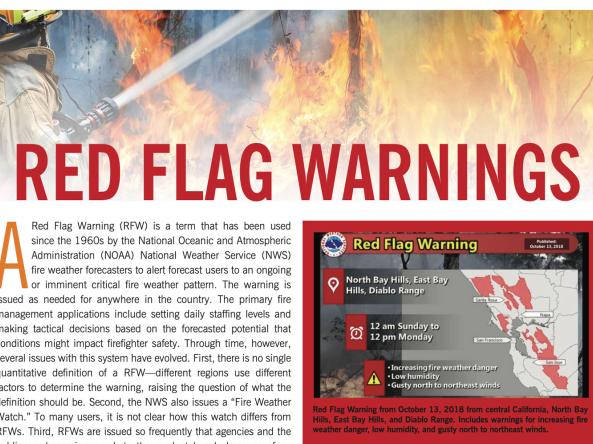
The National Weather Service Weather Prediction Center's Day 3–7 Hazards Outlook shows potential hazardous conditions related to precipitation/flooding, temperature, wildfire/winds, and soils/
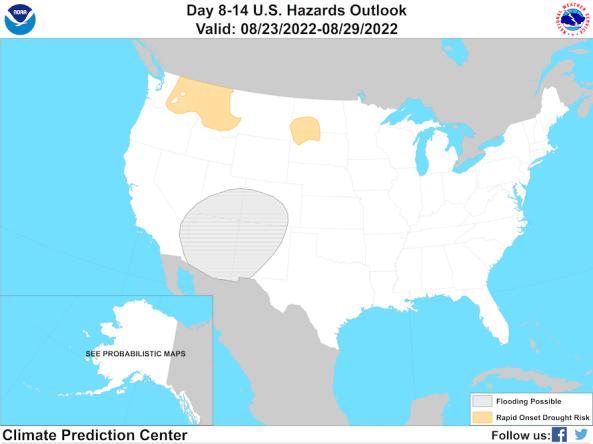
The Climate Prediction Center's Day 8–14 (Week 2) U.S. Hazards Outlook shows potential hazardous conditions related to temperature, precipitation, wind, snow, and rapid onset drought.
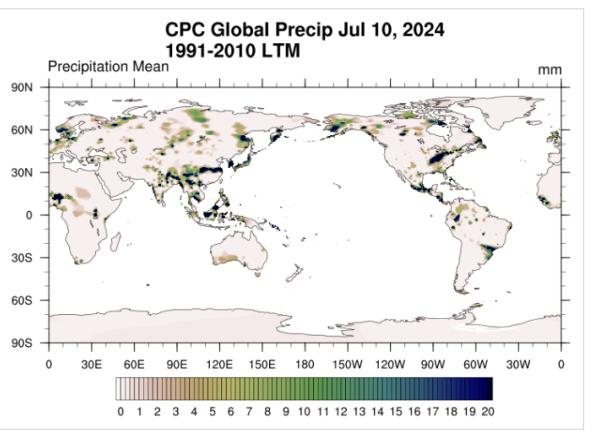
The National Weather Service's Climate Prediction Center (CPC) produces a Global Unified Daily Precipitation product from 1979-present.
The NOAA Climate Prediction Center (CPC) Standardized Precipitation Index (SPI) a probabilistic index derived from North American Multi-Model Ensemble (NMME) precipitation data computed f
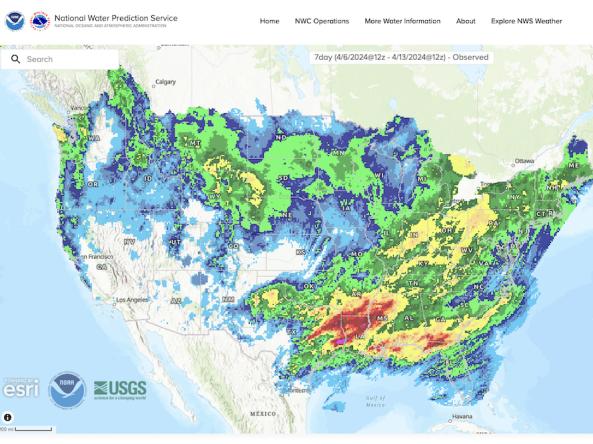
The National Weather Service's National Water Prediction Service (NWPS) provides short-term observed and climatic trends of precipitation across the lower 48 United States (CONUS), Puerto Ric
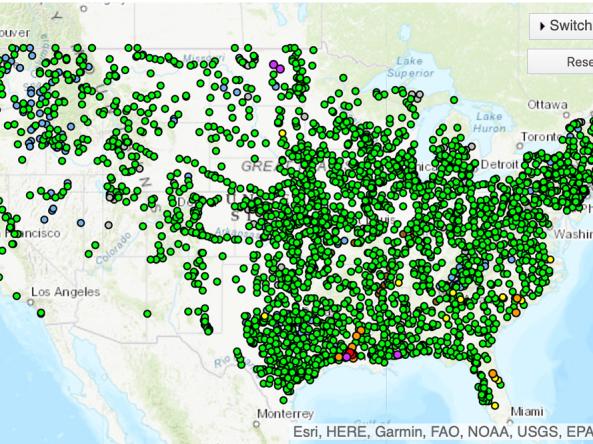
The National Weather Service's National Water Prediction Service (NWPS) provides river stage observations and forecasts and long-range river flood outlooks across the lower 48 Unite
National Weather Service drought information statements provide up-to-date reports on the current drought situation for a Weather Forecast Office’s county warning and forecast area.
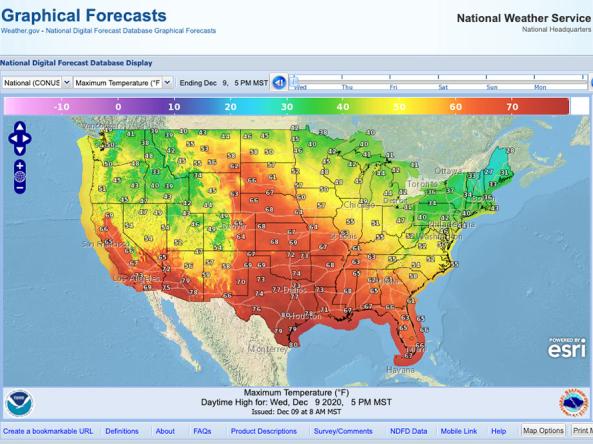
NWS Graphical Forecast is an interactive map that displays current and forecasted meteorological products including: Temperature, Precipitation, Probability of Precipitation, Weather, Hazards, Dew
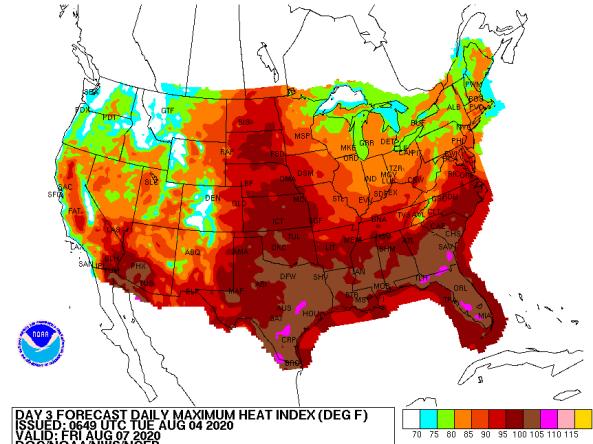
The National Weather Service (NWS) issues heat index forecasts for days 3–7, including daily maximum heat index, daily mean heat index, and daily minimum heat index forecasts.
NWS provides a wide selection of forecast maps for temperature and precipitation for the next 12 hours to 6 days.
The NOAA Climate Prediction Center's El Niño-Southern Oscillation (ENSO) Diagnostic Discussion provides a synopsis of current ENSO conditions and outlooks for the coming seasons.
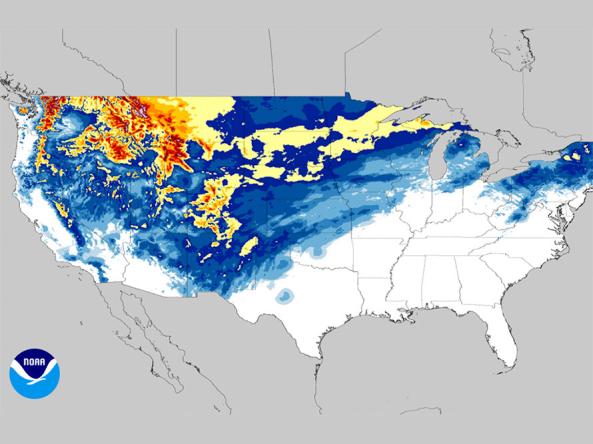
NOHRSC snow products include estimates of snow water equivalent, snow depth, snow pack temperatures, snow sublimation, snow evaporation, blowing snow, modeled and observed snow information, a
NWS WPC produces Quantitative Precipitation Forecasts (QPFs) that depict the amount of liquid precipitation expected to fall in a defined period of time.
SNODAS provides estimates of snow cover, depth, snow water equivalent (SWE) and associated variables to support hydrologic modelling and analysis.
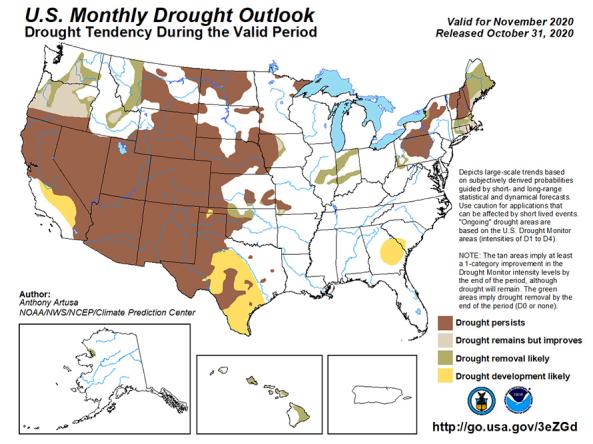
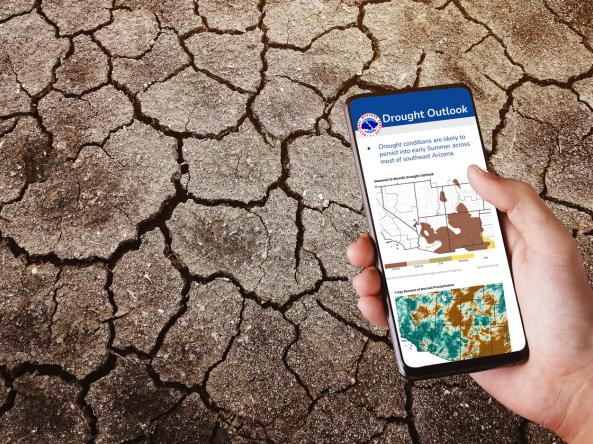
The U.S. Monthly Drought Outlook predicts whether drought will emerge, stay the same or get better over the next 30 days or so.
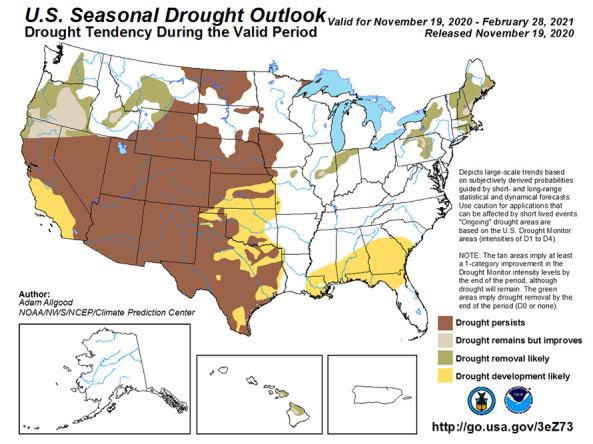
The U.S. Seasonal Drought Outlook depicts large-scale trends based on subjectively derived probabilities guided by short- and long-range statistical and dynamical forecasts.
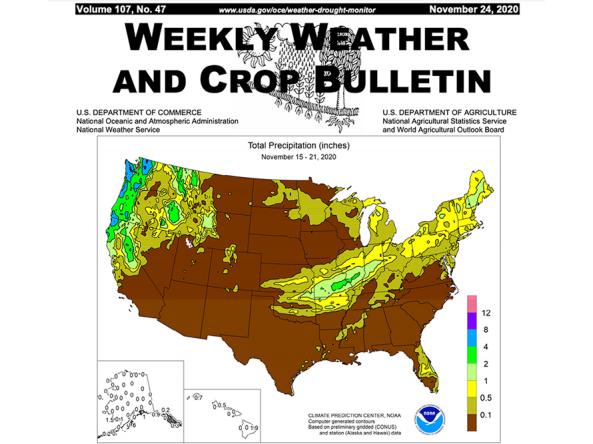
The Weekly Weather and Crop Bulletin (WWCB) provides a vital source of information on weather, climate, and agricultural developments worldwide, along with maps and charts appropriate for the seaso


