June Precipitation and the Start of the Monsoon Could Bring Drought Relief, but Odds Favor Drier Conditions through Fall Due to Likely Transition to La Niña.
Much of the Four Corners states (New Mexico, Arizona, Colorado, Utah) and parts of Nevada experienced a relatively wet June. This precipitation was partially due to remnants of Tropical Storm Alberto. This surge in moisture, when combined with the 2024 North American Monsoon, will improve, but likely will not eliminate drought in the region. Forecasts suggest a mediocre end to the monsoon season, which would expand drought in the Southwest.
Key Points
- The North American Monsoon is the seasonal weather circulation feature that brings summer precipitation to the Southwest and the Intermountain West. The monsoon season typically runs from June 15 to September 30.
- Monsoon precipitation can improve perennial and seasonal streamflow, benefit groundwater recharge, and help replenish local reservoirs and stock ponds. However, it is only a fraction of the water supply derived from snowpack in the Western U.S.
- On average, monsoonal rainfall accounts for nearly 50% of the total annual precipitation across much of Arizona and New Mexico. For example, the 1991–2020 average annual precipitation for Albuquerque is 8.84 inches and the July–September average is 4.10 inches.
- June precipitation stemming from the remnants of Tropical Storm Alberto benefited the Four Corners region (Colorado, Utah, New Mexico, Arizona).
- Precipitation in New Mexico quelled wildfires in Ruidoso, New Mexico. However, these storms also led to post-wildfire flooding.
- June precipitation and the start of the North American Monsoon have resulted in some short-term (seasonal) drought relief for vegetation and ecosystems in the region, especially in areas of Colorado, Arizona, and New Mexico.
- The NOAA National Weather Service Climate Prediction Center’s latest 3-month (July–September) outlook calls for below-normal precipitation across the monsoonal region with the New Mexico–Arizona border most impacted, reaching into southeast Utah and southwest Colorado.
- The latest 3-month (July–September) temperature outlook also favors above-normal temperatures for this region, centered near the Four Corners area.
What Is the North American Monsoon? Why Does It Matter?
The North American Monsoon is a seasonal circulation of subtropical moisture that develops over northern Mexico and extends into the Southwest U.S. from June 15–September 30. This pattern results in frequent thunderstorms across Arizona, New Mexico, Colorado, and southern/eastern Utah. Monsoonal surges can also occur north and west of these "core" areas at various times during the summer, reaching Nevada, southeastern California, and Wyoming, including the Greater Yellowstone Region.
Monsoonal rainfall can improve grassland health for livestock and grazing and benefit agricultural production. The risk of lightning strikes is higher during the monsoon, and early season dry thunderstorms can increase wildfire risk, but as the season progresses the wetter landscape is less prone to large wildland fires. Wildlife also benefits from active monsoon seasons, though an inactive monsoon can stress wildlife.
Figure 1. The North American Monsoon
Key Takeaway: Monsoonal weather patterns are caused by a seasonal wind shift or reversal and high pressure system, driving the initiation of the monsoon precipitation.
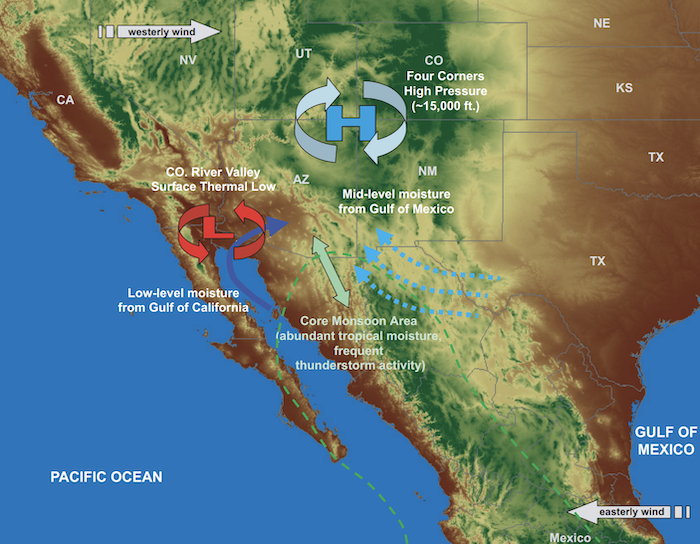
- Monsoonal weather patterns are caused by a seasonal wind shift or reversal, which occurs between June 15–September 30, depending on geographic location.
- The development of the subtropical ridge of high pressure near the Four Corners region in the Southwest often initiates monsoon activity. Arizona and New Mexico receive as much as 40-75% of their annual precipitation during the monsoon season. Movement of the ridge can suppress precipitation, which sometimes contributes to rapid drought onset.
- The monsoon has a lesser influence in Nevada and California, though areas of southern Nevada and southeastern California can receive periodic significant monsoonal precipitation and a lack of precipitation can contribute to the start of drought conditions.
- The Greater Yellowstone region of Wyoming can also receive periodic monsoonal precipitation.
- The monsoon can vary in intensity and location from year to year. When the monsoon is inactive, there is little rainfall, increasing ecological drought and wildfire risk.
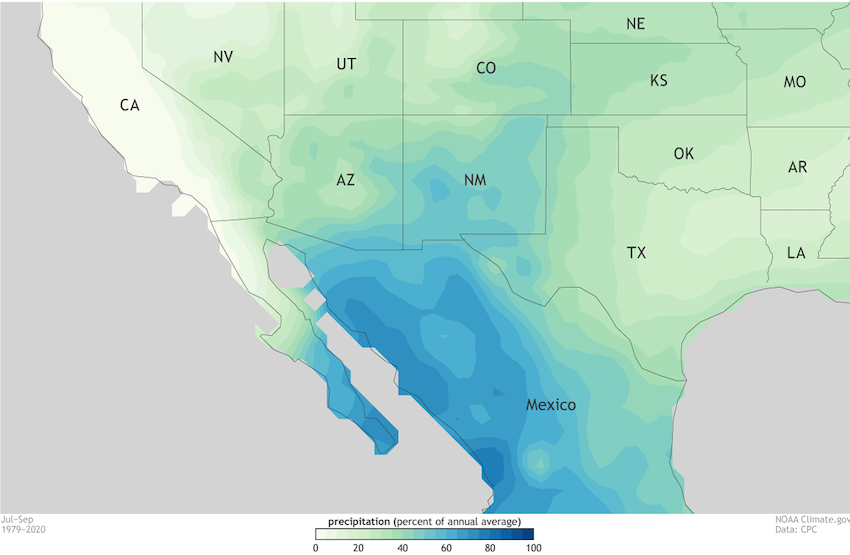
Figure 2. North American Monsoon Contribution to Annual Rainfall
Key Takeaway: Monsoon precipitation is an important component of total water year precipitation for southwestern states.
How Has Summer Precipitation to Date Set the Stage for the North American Monsoon?
- Prior to the 2024 Monsoon Season, all five Intermountain West states were experiencing some level of drought (D1-D4), the June 4 U.S. Drought Monitor Map reported: 20.02% of Arizona; 72.41% of New Mexico; 12.89% of Colorado; 6.17% of Wyoming; 0.40% of Utah. California and Nevada had no drought at the beginning of June.
- July precipitation has tapered off for Arizona, Utah, Nevada, and California, but isolated areas of Colorado and New Mexico have received consistent precipitation.
- Parts of New Mexico have received 200% of normal precipitation in June. Arizona received normal to just above normal precipitation in June.
Figure 3. Pre-Monsoon Drought Conditions (June 4, 2024)
Key Takeaway: Pre-monsoon season drought conditions were most severe in southern New Mexico, with areas of drought present in Arizona, Colorado, New Mexico, Utah, and Wyoming.
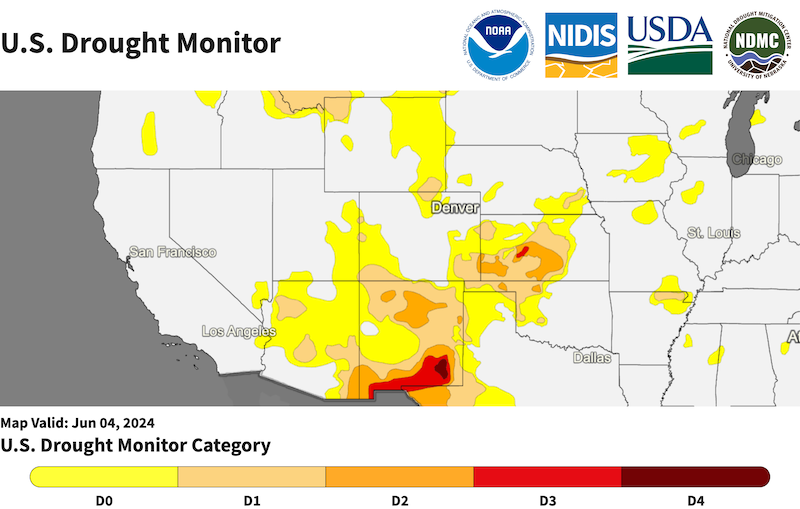
Figure 4. June 2024 Precipitation Values by State
Key Takeaway: New Mexico’s June precipitation was almost 200% of the 1901–2000 mean. Wyoming was below the mean. The rest of the Intermountain West and California and Nevada received precipitation near or slightly above the mean.
State | June 2024 Precipitation (Inches) | 1901–2000 Mean (Inches) | Departure from Mean (Inches) |
June 2024 precipitation values by state (inches), alongside the 1901–2020 mean for June, and the departure from mean precipitation. Source: NOAA National Centers for Environmental information, Climate at a Glance: Statewide Rankings.
Figure 5. June 2024 Statewide Precipitation Anomalies
Key Takeaway: Wyoming received 39% of mean precipitation in June 2024 (its 11th driest June on record), with precipitation 1.13 inches below the mean, while New Mexico was close to 200% of mean (a surplus of 0.97 inch).
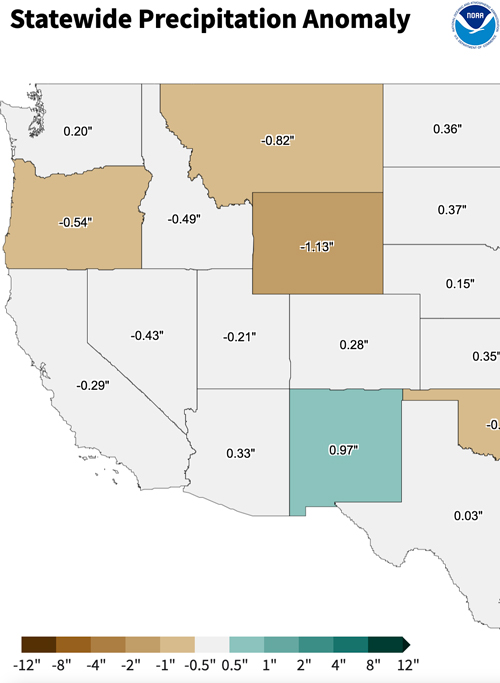
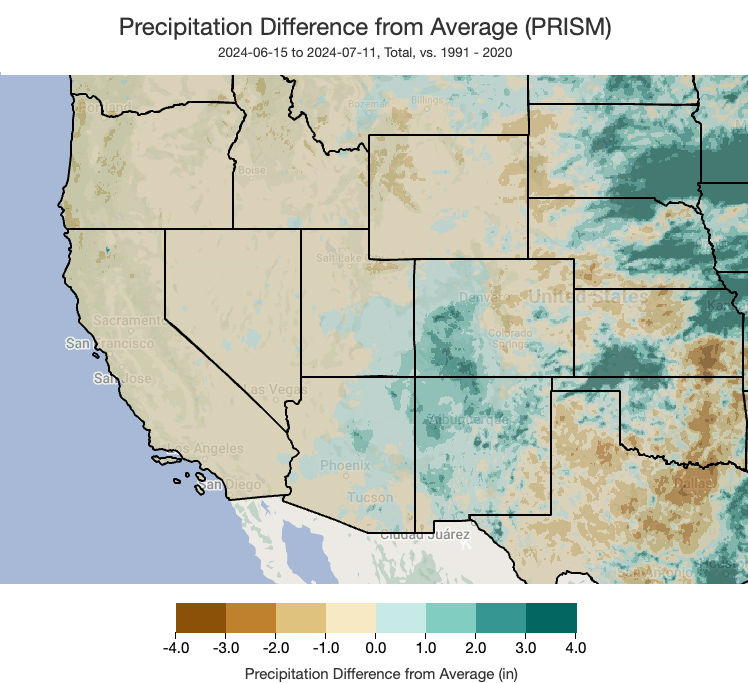
Figure 6. June 15–July 11, 2024 Precipitation Difference from Average (1991–2020)
Key Takeaway: The Four Corners region of the Southwest has received above-normal precipitation since the start of the 2024 Monsoon Season.
Will the North American Monsoon Be Active through September?
- Seasonal forecasts of monsoon precipitation are largely based on continental or global-scale influences, while the broader monsoon weather pattern is governed by local-scale processes that can change quickly.
- For the 2024 Monsoon Season, NOAA’s Climate Prediction Center’s seasonal (July–September) precipitation outlook shows increased odds of below-normal precipitation, with the greatest odds of low precipitation along the Four Corners region (Arizona, New Mexico, Colorado, and Utah).
- Combined with above-normal temperatures, the Climate Prediction Center’s Seasonal Drought Outlook suggests drought persistence with some development is likely, primarily in the Four Corners region of the Intermountain West.
- For short-term forecasts, see the Quantitative Precipitation Forecast (QPF) or your local National Weather Service Weather Forecast Office.
- Evolving methods for forecasting the North American Monsoon have been explored with promising outcomes. Using the frequency of surges in atmospheric moisture in the U.S. Southwest as a proxy for rainfall has provided skillful rainfall predictions starting in April, which is helpful for regional water managers’ decision making surrounding mitigation of both droughts and floods (see Prein et al. 2022 and references therein).
Figure 7. Seasonal Precipitation Outlook (August–October 2024)
Key Takeaway: According to NOAA’s Climate Prediction Center, there is a 33-40% chance of below-average precipitation across much of the Intermountain West from August to October, and a 40-50% chance of below-average precipitation in parts of Utah, Colorado, and Wyoming over the same period.
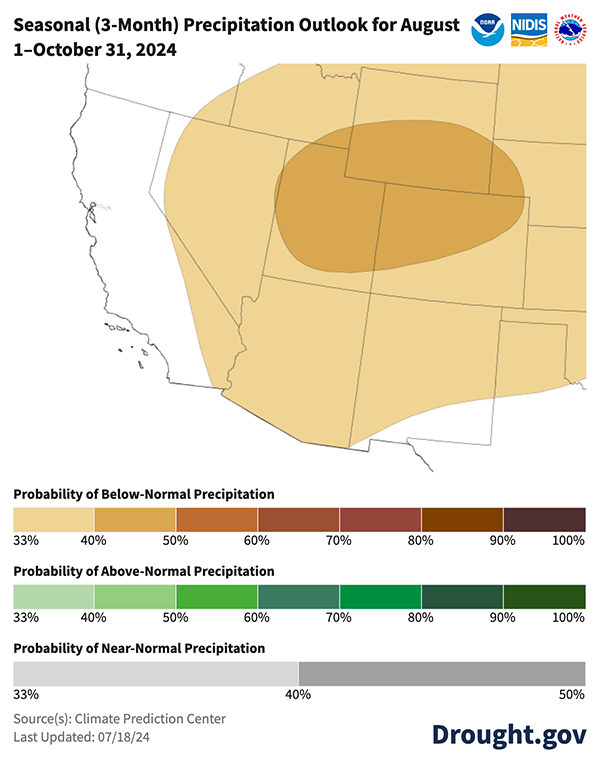
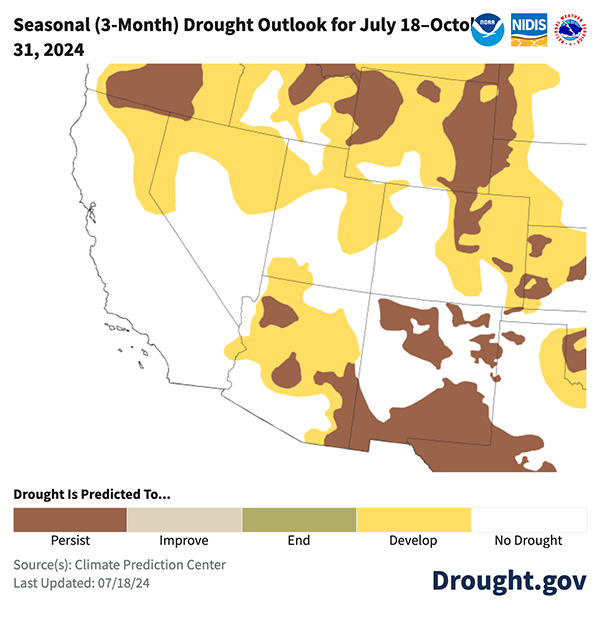
Figure 8. Seasonal Drought Outlook (July–October 2024)
Key Takeaway: NOAA’s Climate Prediction Center’s Seasonal Drought Outlook suggests drought persistence with some development is likely in Northern California, Nevada, Utah, Colorado, and Arizona.
What Does the El Niño–Southern Oscillation (ENSO) Mean for the North American Monsoon?
- Some research suggests summers with La Niña conditions tend to favor robust monsoon activity in June and July, and summers with El Niño conditions tend to favor less active monsoons.
- As of July 11, 2024, ENSO-neutral conditions are expected to continue for the next several months. In the past, ENSO-neutral periods typically have had equal chances of above- or below-normal precipitation.
- La Niña is favored to emerge during August–October (70% chance) and persist into the Northern Hemisphere winter 2024–25 (79% chance during November–January).
- The relationship between the monsoon and El Niño/La Niña events is hard to predict, though there is evidence of a correlation.
- If the potential La Niña extends into the winter, it will likely favor drier conditions in the Southwest over the winter months.
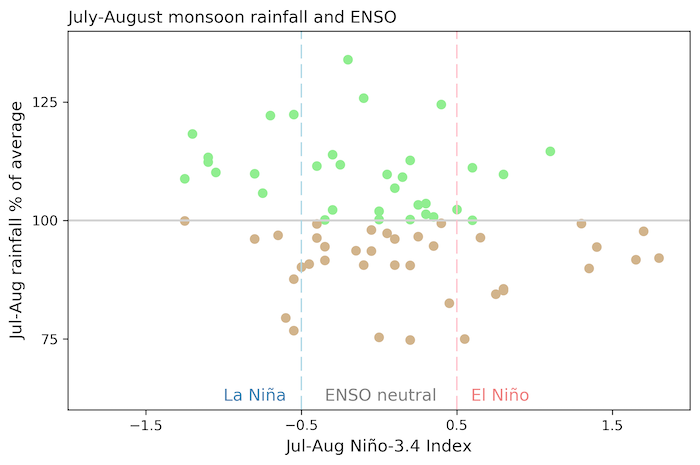
Figure 9. Monsoon Season and the El Niño-Southern Oscillation (ENSO)
Key Takeaway: Monsoon season precipitation tends to be above average during La Niña periods as compared to El Niño periods. The 2023 Monsoon Season occurred during an El Niño summer, and conditions were much drier than normal for most of the Intermountain West states. In 2023, Arizona, New Mexico, Colorado, and Utah had their 27th driest June–September on record.
What Does This Mean for Drought?
A weak or inactive monsoon season can worsen short- and long-term drought conditions. For example, the inactive 2023 Monsoon Season resulted in significant drought expansion for New Mexico and Arizona. Meanwhile, an average to above-average monsoon can potentially ameliorate drought conditions, such as the 2022 Monsoon, which was the 9th wettest on record and significantly improved drought conditions in Arizona and New Mexico.
The 2024 North American Monsoon is predicted to be less active, according to NOAA’s Climate Prediction Center’s seasonal outlooks. However, above-normal to normal precipitation is slightly favored for some of the Southwestern U.S. for the remainder of July, which could help mitigate drought development into August. ENSO-neutral conditions are predicted to shift to La Niña in August–October (70% chance), and temperatures are forecasted to be above normal, which increases the likelihood of drought development over the fall and winter months.
| Monsoon | Below-Average Precipitation | Near-Average Precipitation | Above-Average Precipitation |
|---|---|---|---|
| Impact on Drought | Long- and short-term drought in the region would worsen, potentially similar to what happened in summer 2023. | Short-term drought improvement is possible. | This could help ameliorate, and mitigate development of, short-term drought in the Southwest. |
| Water Storage | Water storage in the region will continue to drop as demand stresses supply. | An average-to-above average monsoon can increase water storage and replenish stock ponds in parts of the region, but not by significant amounts. Research has shown that summer precipitation is less efficient than winter precipitation at alleviating hydrologic drought. However, more active monsoon does reduce outdoor water demand, which has a positive impact on water supply. | |
| Wildland Fire | Elevated wildland fire potential to continue through summer for the region. | Fire potential to return to near normal for this time of year. | Fire potential to return to near normal for this time of year. |
Potential drought impacts if the Southwest receives below-average, near-average, or above-average precipitation during the 2024 North American Monsoon Season.
For More Information
- Local NOAA National Weather Service pages:
- Active National Weather Service Drought Information Statements
- Climate Assessment for the Southwest (a NOAA CAP/RISA team)
- Drought.gov: Soil Moisture Data & Maps
Prepared By
Dr. Gretel Follingstad; Dr. Amanda Sheffield; Kelsey Satalino; Eleanor Hasenbeck
Cooperative Institute for Research in Environmental Sciences | University of Colorado Boulder
NOAA/National Integrated Drought Information System (NIDIS)
Dave Simeral
Western Regional Climate Center/Desert Research Institute
Dr. Erinanne Saffell
Arizona State Climatologist
Victor Murphy, Michael Natoli, Mark O'Malley
NOAA National Weather Service
Dr. Dave DuBois
New Mexico State Climatologist
Laura Haskell
Utah Department of Natural Resources
Joseph Casola
Western Regional Climate Services Director, NOAA/National Centers for Environmental Information
This Special Edition Drought Status Update is issued in partnership between the National Oceanic and Atmospheric Administration (NOAA)/National Integrated Drought Information System (NIDIS) and partners across the Intermountain West and California-Nevada Drought Early Warning Systems. The purpose of the update is to communicate current conditions, outlooks, and potential impacts for the 2024 North American Monsoon Season. NIDIS and its partners will issue future Drought Status Updates as conditions evolve.

