Evaporative Demand Drought Index (EDDI)
National Oceanic and Atmospheric Administration (NOAA) Earth System Research Laboratories (ESRL) Physical Sciences Laboratory (PSL)
The Evaporative Demand Drought Index (EDDI) is an experimental tool that examines how anomalous the atmospheric evaporative demand (E0; also known as "the thirst of the atmosphere") is for a given location and across a time period of interest. EDDI maps use atmospheric evaporative demand anomalies across a timescale of interest relative to its climatology to indicate the spatial extent and severity of drought. EDDI can serve as an indicator of both rapidly evolving "flash" droughts (developing over a few weeks) and sustained droughts (developing over months but lasting up to years).
The Evaporative Demand Drought Index (EDDI) is a drought monitoring tool that shows the anomaly in daily evaporative demand over a given period time. Evaporative demand is the atmospheric influence on the drying of the landscape, or "the thirst of the atmosphere." Unusually high evaporative demand can lead to moisture stress on the land surface, and ultimately to drought—even when precipitation has been near-normal.
EDDI can serve as an indicator of both rapidly evolving "flash" droughts and sustained droughts and can offer early warning of agricultural drought, hydrologic drought, and fire-weather risk.
A drought index combines multiple drought indicators (e.g., precipitation, temperature, soil moisture) to depict drought conditions. For some products, like the U.S. Drought Monitor, authors combine their analysis of drought indicators with input from local observers. Other drought indices, like the Standardized Precipitation Index (SPI), use an objective calculation to describe the severity, location, timing, and/or duration of drought.
Learn MoreFlash drought is the rapid onset or intensification of drought. Unlike slow-evolving drought, which is caused by a decline in precipitation, flash drought occurs when low precipitation is accompanied by abnormally high temperatures, high winds, and/or changes in radiation. These sometimes-rapid changes can quickly raise evapotranspiration rates and remove available water from the landscape.
Learn MoreDrought can result in reduced growth rates, increased stress on vegetation, and alterations or transformations to the plant community and/or the entire ecosystem. During periods of drought, plants increase their demand for water through increased evapotranspiration and longer growing seasons.
Learn MoreDuring drought conditions, fuels for wildfire, such as grasses and trees, can dry out and become more flammable. Drought can also increase the probability of ignition and the rate at which fire spreads. Temperature, soil moisture, humidity, wind speed, and fuel availability (vegetation) are all factors that interact to influence the frequency of large wildfires.
Learn MoreA drought index combines multiple drought indicators (e.g., precipitation, temperature, soil moisture) to depict drought conditions. For some products, like the U.S. Drought Monitor, authors combine their analysis of drought indicators with input from local observers. Other drought indices, like the Standardized Precipitation Index (SPI), use an objective calculation to describe the severity, location, timing, and/or duration of drought.
Learn MoreFlash drought is the rapid onset or intensification of drought. Unlike slow-evolving drought, which is caused by a decline in precipitation, flash drought occurs when low precipitation is accompanied by abnormally high temperatures, high winds, and/or changes in radiation. These sometimes-rapid changes can quickly raise evapotranspiration rates and remove available water from the landscape.
Learn MoreDrought can result in reduced growth rates, increased stress on vegetation, and alterations or transformations to the plant community and/or the entire ecosystem. During periods of drought, plants increase their demand for water through increased evapotranspiration and longer growing seasons.
Learn MoreDuring drought conditions, fuels for wildfire, such as grasses and trees, can dry out and become more flammable. Drought can also increase the probability of ignition and the rate at which fire spreads. Temperature, soil moisture, humidity, wind speed, and fuel availability (vegetation) are all factors that interact to influence the frequency of large wildfires.
Learn MoreDrought Conditions
ED4: Exceptional Drought
Compared to "normal" conditions, evaporative demand is greater than 98% to 100% of historical values. Learn more about these categories.
ED3: Extreme Drought
Compared to "normal" conditions, evaporative demand is greater than 95% to 98% of historical values. Learn more about these categories.
ED2: Severe Drought
Compared to "normal" conditions, evaporative demand is greater than 90% to 95% of historical values. Learn more about these categories.
ED1: Moderate Drought
Compared to "normal" conditions, evaporative demand is greater than 80% to 90% of previous values. Learn more about these categories.
ED0: Abnormally Dry
Compared to "normal" conditions, evaporative demand is greater than 70% to 80% of historical values. Learn more about these categories.
Wet Conditions
EW0: Abnormally Wet
Compared to "normal" conditions, current evaporative demand is in the bottom 20% to 30% of historical values (i.e., only 20%–30% of previous values had lower evaporative demand). Learn more about these categories.
EW1: Moderate Wet
Compared to "normal" conditions, current evaporative demand is in the bottom 10% to 20% of historical values (i.e., only 10%–20% of previous values had lower evaporative demand). Learn more about these categories.
EW2: Severe Wet
Compared to "normal" conditions, current evaporative demand is in the bottom 5% to 10% of historical values (i.e., only 5%–10% of previous values had lower evaporative demand). Learn more about these categories.
EW3: Extreme Wet
Compared to "normal" conditions, current evaporative demand is in the bottom 2% to 5% of historical values (i.e., only 2%–5% of previous values had lower evaporative demand). Learn more about these categories.
EW4: Exceptional Wet
Compared to "normal" conditions, current evaporative demand is in the bottom 0% to 2% of historical values (i.e., less than 2% of previous values had lower evaporative demand). Learn more about these categories.
Drought Conditions
ED4: Exceptional Drought
Compared to "normal" conditions, evaporative demand is greater than 98% to 100% of historical values. Learn more about these categories.
ED3: Extreme Drought
Compared to "normal" conditions, evaporative demand is greater than 95% to 98% of historical values. Learn more about these categories.
ED2: Severe Drought
Compared to "normal" conditions, evaporative demand is greater than 90% to 95% of historical values. Learn more about these categories.
ED1: Moderate Drought
Compared to "normal" conditions, evaporative demand is greater than 80% to 90% of previous values. Learn more about these categories.
ED0: Abnormally Dry
Compared to "normal" conditions, evaporative demand is greater than 70% to 80% of historical values. Learn more about these categories.
Wet Conditions
EW0: Abnormally Wet
Compared to "normal" conditions, current evaporative demand is in the bottom 20% to 30% of historical values (i.e., only 20%–30% of previous values had lower evaporative demand). Learn more about these categories.
EW1: Moderate Wet
Compared to "normal" conditions, current evaporative demand is in the bottom 10% to 20% of historical values (i.e., only 10%–20% of previous values had lower evaporative demand). Learn more about these categories.
EW2: Severe Wet
Compared to "normal" conditions, current evaporative demand is in the bottom 5% to 10% of historical values (i.e., only 5%–10% of previous values had lower evaporative demand). Learn more about these categories.
EW3: Extreme Wet
Compared to "normal" conditions, current evaporative demand is in the bottom 2% to 5% of historical values (i.e., only 2%–5% of previous values had lower evaporative demand). Learn more about these categories.
EW4: Exceptional Wet
Compared to "normal" conditions, current evaporative demand is in the bottom 0% to 2% of historical values (i.e., less than 2% of previous values had lower evaporative demand). Learn more about these categories.
The Evaporative Demand Drought Index (EDDI) is a drought monitoring tool that shows the anomaly in daily evaporative demand over a given period time. Evaporative demand is the atmospheric influence on the drying of the landscape, or "the thirst of the atmosphere." Unusually high evaporative demand can lead to moisture stress on the land surface, and ultimately to drought—even when precipitation has been near-normal.
EDDI can serve as an indicator of both rapidly evolving "flash" droughts and sustained droughts and can offer early warning of agricultural drought, hydrologic drought, and fire-weather risk.
The Evaporative Demand Drought Index is updated daily, with a 5-day delay. This delay results from the procedures to quality control the meteorological data used to estimate evaporative demand.
The Evaporative Demand Drought Index is updated daily, with a 5-day delay. This delay results from the procedures to quality control the meteorological data used to estimate evaporative demand.
A drought index combines multiple drought indicators (e.g., precipitation, temperature, soil moisture) to depict drought conditions. For some products, like the U.S. Drought Monitor, authors combine their analysis of drought indicators with input from local observers. Other drought indices, like the Standardized Precipitation Index (SPI), use an objective calculation to describe the severity, location, timing, and/or duration of drought.
Learn MoreFlash drought is the rapid onset or intensification of drought. Unlike slow-evolving drought, which is caused by a decline in precipitation, flash drought occurs when low precipitation is accompanied by abnormally high temperatures, high winds, and/or changes in radiation. These sometimes-rapid changes can quickly raise evapotranspiration rates and remove available water from the landscape.
Learn MoreDrought can result in reduced growth rates, increased stress on vegetation, and alterations or transformations to the plant community and/or the entire ecosystem. During periods of drought, plants increase their demand for water through increased evapotranspiration and longer growing seasons.
Learn MoreDuring drought conditions, fuels for wildfire, such as grasses and trees, can dry out and become more flammable. Drought can also increase the probability of ignition and the rate at which fire spreads. Temperature, soil moisture, humidity, wind speed, and fuel availability (vegetation) are all factors that interact to influence the frequency of large wildfires.
Learn MoreA drought index combines multiple drought indicators (e.g., precipitation, temperature, soil moisture) to depict drought conditions. For some products, like the U.S. Drought Monitor, authors combine their analysis of drought indicators with input from local observers. Other drought indices, like the Standardized Precipitation Index (SPI), use an objective calculation to describe the severity, location, timing, and/or duration of drought.
Learn MoreFlash drought is the rapid onset or intensification of drought. Unlike slow-evolving drought, which is caused by a decline in precipitation, flash drought occurs when low precipitation is accompanied by abnormally high temperatures, high winds, and/or changes in radiation. These sometimes-rapid changes can quickly raise evapotranspiration rates and remove available water from the landscape.
Learn MoreDrought can result in reduced growth rates, increased stress on vegetation, and alterations or transformations to the plant community and/or the entire ecosystem. During periods of drought, plants increase their demand for water through increased evapotranspiration and longer growing seasons.
Learn MoreDuring drought conditions, fuels for wildfire, such as grasses and trees, can dry out and become more flammable. Drought can also increase the probability of ignition and the rate at which fire spreads. Temperature, soil moisture, humidity, wind speed, and fuel availability (vegetation) are all factors that interact to influence the frequency of large wildfires.
Learn MoreHow to
What can I do with these data?
EDDI has been shown to offer early warning of drought stress relative to current operational drought indicators, such as the US Drought Monitor (USDM). A particular strength of EDDI is in capturing the precursor signals of water stress at weekly to monthly timescales, which makes EDDI a potent tool for drought preparedness at those timescales. EDDI also uses the same classification scheme as the USDM to define drought conditions, so it is easy to read EDDI maps.
How do I use the EDDI site?
- Select the “Current Conditions” section of the EDDI web page.
- Select the time unit (weeks or months) and time window of choice (1-12) and press “Plot Map”
Access
Currently, EDDI is generated daily – though with a 5-day lag-time – by analyzing a near-real-time atmospheric dataset. There is also an ongoing effort to forecast EDDI based on seasonal climate-forecast information.
Maps and Time Series Visualization – Real-time maps and time-series analysis from NOAA’s Earth Systems Research Lab (ESRL)
GridMET-Based EDDI
In addition to the EDDI produced by NOAA's Physical Science Laboratory (based on NLDAS data), the Drought.gov team produces an EDDI product via the Climate Engine tool that uses the GridMET daily dataset, using a 1991–2020 reference period, nonparametric distribution, and Penman-Monteith PET (potential evapotranspiration).
View more documentation on the GridMET-based EDDI from Climate Engine.
Documention
Description
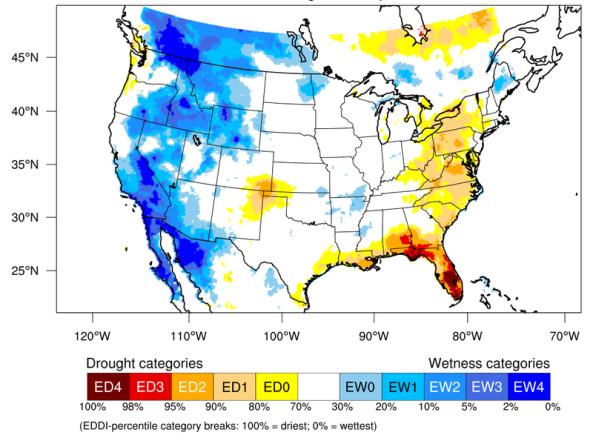
The Evaporative Demand Drought Index (EDDI) uses atmospheric evaporative demand (E0) anomalies across a timescale of interest relative to its climatology to indicate the spatial extent and severity of drought. The E0 is calculated using the Penman-Monteith FAO56 reference evapotranspiration formulation (0.5-m tall reference crop), driven by data on temperature, humidity, wind speed, and incoming solar radiation, with these data extracted from the operational North American Land Data Assimilation System (NLDAS-2) dataset. For a particular time-window, EDDI is estimated by standardizing the E0 anomalies relative to the same accumulation time-window in the whole period of record (1979-present), using a rank-based non-parametric method described in Hobbins et al. (2016; see the "Resources" tab). EDDI data are available at a ~12-km resolution (0.125° lat and long) across CONUS since January 1, 1980, and are updated daily.
On the EDDI Category Maps, colors indicate the frequency at which the observed E0 anomaly has occurred in the climatology, with warm colors indicating conditions that are drier than normal and cool colors indicating wetter-than-normal conditions. As an example, the ED4 category indicates that the current E0 anomaly has only been observed less than 2% of the time in the past 38 years (1979-2016), which represents the most severe drought conditions; the EW4 category means indicates that the anomaly has been exceeded 98% of the time, which represents the wettest conditions. For plotting purposes, EDDI values are binned into different percentile categories analogous to the U.S. Drought Monitor plots—however, in case of EDDI plots, both drought and anomalously wet categories are shown.
EDDI has the potential to offer early warning of agricultural drought, hydrologic drought, and fire-weather risk by providing real-time information on the emergence or persistence of anomalous evaporative demand in a region. A particular strength of EDDI is in capturing the precursor signals of water stress at weekly to monthly timescales, which makes EDDI a strong tool for drought preparedness at those timescales.
Related Web Pages
- EDDI: A powerful tool for early drought warning (2-page PDF from the Western Water Assessment)
- WWA: Intermountain West Climate Dashboard
- PSD News: New tool effectively identifies both rapid-onset and sustained droughts
References
- Michael Hobbins, Andrew Wood, Daniel McEvoy, Justin Huntington, Charles Morton, James Verdin, Martha Anderson, and Christopher Hain (June 2016): The Evaporative Demand Drought index: Part I – Linking Drought Evolution to Variations in Evaporative Demand. J. Hydrometeor., 17(6),1745-1761. doi:10.1175/JHM-D-15-0121.1.
- Daniel J. McEvoy, Justin L. Huntington, Michael T. Hobbins, Andrew Wood, Charles Morton, James Verdin, Martha Anderson, and Christopher Hain (June 2016) The Evaporative Demand Drought index: Part II – CONUS-wide Assessment Against Common Drought Indicators. J. Hydrometeor., 17(6), 1763-1779. doi:10.1175/JHM-D-15-0121.1.
Acknowledgements
This work is supported in part by grants from (i) NOAA’s Research Transition Acceleration Program (RTAP) for the project titled “Operationalizing an Evaporative Demand Drought Index (EDDI) service for drought monitoring and early warning;” (ii) NOAA’s Sectoral Applications Research Program (SARP): Coping with Drought in Support of the National Integrated Drought Information System (NIDIS) program for the project titled “Developing a wildfire component for the NIDIS California Drought Early Warning System;” and (iii) DOI's North Central Climate Adaptation Science Center for the project titled "Evaporation, Drought, and the Water Cycle across Timescales.”