GPS for Drought Monitoring: Leveraging the Power of Satellites to Quantify Regional Water Deficits
This article provides an overview of the study, Drought Characterization with GPS: Insights into Groundwater and Surface-Reservoir Storage in California, published in Water Resources Research.
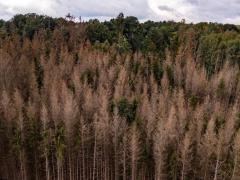
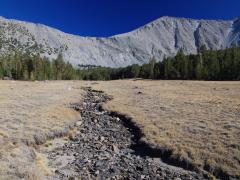
Drought intensity is often characterized using meteorological observations, such as precipitation, rather than hydrologic observations, such as reservoir levels and groundwater levels. While precipitation indicates the amount of water entering an area, precipitation models do not determine the amount of water retained in a watershed or the amount lost due to runoff and evapotranspiration, which are important factors for drought management.
Researchers from the University of Montana addressed this need by producing a drought index that captures changes in both surface and subsurface hydrologic reservoirs/pools using a rapidly growing interdisciplinary field called hydrogeodesy. Hydrogeodesy quantifies changes in water volume based on how the shape of the Earth changes under the weight of the water.
In this study, the researchers used hydrologic load estimates, calculated using three-dimensional global positioning system (GPS) data, to develop a GPS-based drought index (GDI). The study focused on California, where the GPS network is particularly dense and hydrologic observations from several sources are available. The GDI, and hydrogeodesy in general, works as follows: during dry periods, water leaves the system and unloads (i.e., removes weight from) the surface of the Earth, causing the ground elevation to rise. When water enters the system, the surface is loaded (i.e., adds weight, exerting a downward force), and the Earth's surface subsides. In addition, the ground moves horizontally toward a source of loading and away from a region of unloading. GPS data are particularly sensitive to these displacements.
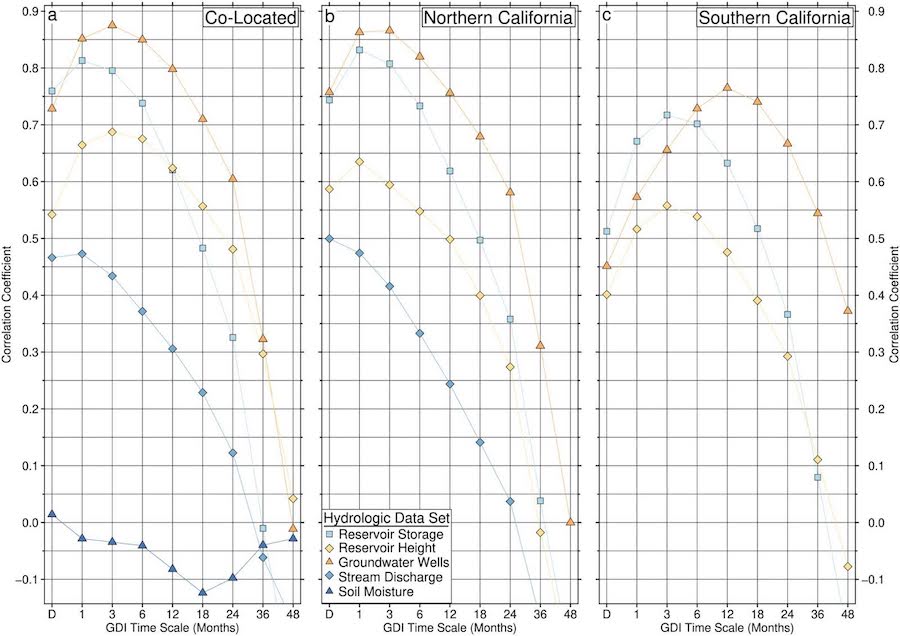
The researchers found that the GDI is strongly sensitive to variations in groundwater and reservoir storage across California as a whole, but can also identify unique, optimal time scales for regions of California consistent with differences in regional hydrologic systems (see figure below). The preferred GDI time scales for each region were strong predictors of groundwater and surface water storage. Stream discharge shows this behavior as well, although with weaker correlation. In addition to capturing long-term hydrologic drought trends, the study reveals recharge associated with clusters of atmospheric river events (i.e., strong precipitation events caused by concentrated bands of water vapor) was observed throughout the study period.
The GDI may become an important new addition within the drought management toolbox. In the past, it has been particularly difficult to capture groundwater trends using well observations, so the strong sensitivity of the GDI to groundwater anomalies is particularly notable. This could improve water storage management, particularly in regions that rely heavily on groundwater for irrigation and drinking water supplies, such as California’s Central Valley.
While this study focused on California, the methods presented here to compute the GDI are readily scalable to other states and regions in the United States and even worldwide. Toward that goal, the researchers are developing an operational GDI for the contiguous United States, with an expected latency of under 48 hours. This will provide water resource managers with daily insight into hydrological drought conditions.