Highlighting Drought's Effects on Agriculture
Where is drought impacting hay and livestock production?
Maps highlighting the effects of drought on six agricultural commodities across the continental U.S. are now available on a website hosted by the National Drought Mitigation Center (NDMC) at the University of Nebraska-Lincoln. The maps are a collaboration between the U.S. Department of Agriculture’s (USDA) Office of the Chief Economist (OCE) and the drought center.
The maps, produced at the drought center in cooperation with the USDA World Agriculture Outlook Board and OCE meteorologists, are based on the weekly U.S. Drought Monitor and show the locations and percentages of drought-affected areas that produce crops or livestock. They are released Thursdays at agindrought.unl.edu. In addition to the maps, the website offers data tables, time series graphs and animations.
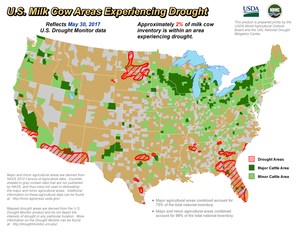
The new maps show drought’s effects on cattle, hogs and pigs, sheep and lambs, hay, and alfalfa. In the future, the partners will make available six field crop maps, one each for corn, cotton, soybeans, winter wheat, spring wheat and durum wheat.
“The Agriculture in Drought website is dynamic in nature, enabling users to interactively explore how drought is impacting agriculture across the United States,” said Harlan Shannon, OCE meteorologist. “Significantly, behind the scenes, NDMC’s geospatial and database capabilities have enabled USDA to more quickly and efficiently estimate — for select agricultural commodities — the percent of acreage or inventory located in drought.”
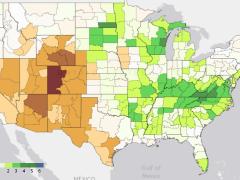
The maps are created by overlaying the most recent U.S. Drought Monitor on maps of major crop- and livestock-producing areas, based on the most current Ag Census data from the National Agricultural Statistics Service. The result highlights agricultural areas affected by any level of drought.
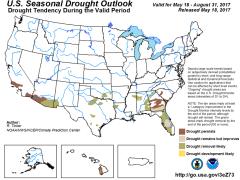
The U.S. Drought Monitor, produced weekly since 1999, is a collaborative effort among federal and academic partners, including the drought center, USDA and the National Oceanic and Atmospheric Administration.