New: EDDI Forecasts Now Available
The Evaporative Demand Drought Index, also known as EDDI, is an experimental drought monitoring and early warning tool that looks for drought using atmospheric evaporative demand (also known as the “thirst of the atmosphere”). So far, EDDI maps and data have been made available for near-real-time and historical monitoring; now, with the help of the NOAA-National Centers for Environmental Information (NCEI), EDDI and evaporative demand probability forecast maps are now available via NCEI’s Drought Termination and Amelioration tool. A team of climate science experts from the Desert Research Institute, Western Regional Climate Center, and University of California at Santa Barbara developed these new forecast products in partnership with the NOAA-Earth System Research Laboratory Physical Sciences Division.
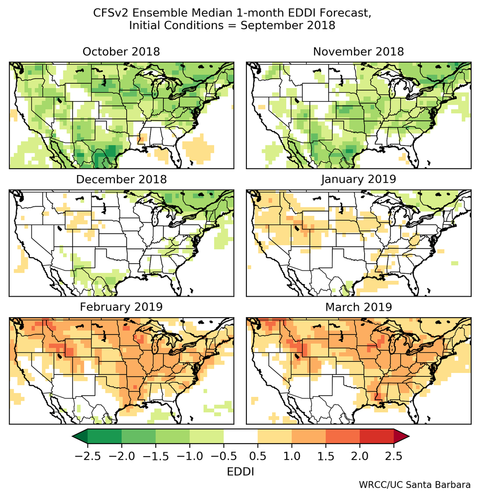
Monthly forecast maps are produced out to six months. A new forecast will be provided on the first day of each month for the following six-month period. The model used to generate EDDI forecasts and the evaporative demand probability forecasts is the Climate Forecast System version 2 (CFSv2), which is the operational model used by the NWS Climate Prediction Center.
Temperature, wind speed, humidity, and solar radiation data are pulled from the CFSv2 model to calculate reference evapotranspiration, which is the “flavor” of evaporative demand used to compute EDDI. Each month, a new reference evapotranspiration ensemble is created from multiple CFSv2 forecasts. The ensemble forecast is then combined with historical data to calculate the probability forecasts and the forecasts of EDDI.
Two studies conducted by the development team validating evaporative demand for drought forecasting show that evaporative demand forecasts typically provide greater skill than precipitation forecasts. The studies also showed that significant skill exists in major agricultural regions globally, particularly from July to November in the United States, which has implications for agricultural drought forecasting. One of the studies also found good predictive skill in the Southwest US for January through March, but poor predictions in the July through September (monsoon months).
EDDI can offer early warning of agricultural drought, hydrologic drought, and fire-weather risk by providing near-real-time information on the emergence or persistence of anomalous evaporative demand in a region. A particular strength of EDDI is in capturing signals of water stress at weekly to monthly timescales, which makes it a strong tool for preparedness for both flash droughts and ongoing droughts.
The next phase for EDDI forecasting is real-time validation, which will determine how good the most recent forecasts have done on a month-by-month basis.
To view the most recent EDDI and evaporative demand probability forecast maps, click here.