NIDIS Launches Improved and Expanded State Pages on Drought.Gov
Drought and its impacts vary from region to region, and a proactive approach to drought planning and resilience requires responsiveness to particular geographic and hydrologic circumstances—and close collaboration between federal, tribal, state, and local governments.
Acknowledging the importance of state-specific drought information and resources, NOAA’s National Integrated Drought Information System (NIDIS) is pleased to announce the launch of new and improved state pages on the U.S. Drought Portal.
The expanded Drought.gov state pages—which NIDIS developed in collaboration with NOAA’s National Centers for Environmental Information and state partners—provide a one-stop shop for state drought information, including interactive and easily shareable maps, statistics, and resources for all 50 states, as well as Puerto Rico, the U.S. Virgin Islands, and the U.S.-Affiliated Pacific Islands.
Drought.gov’s new state pages feature:
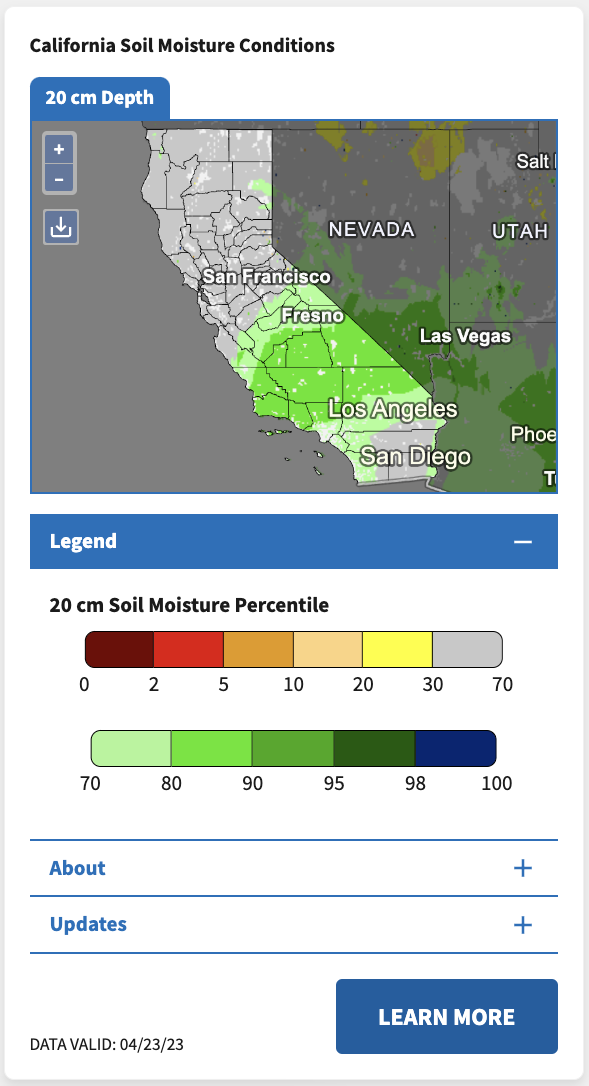
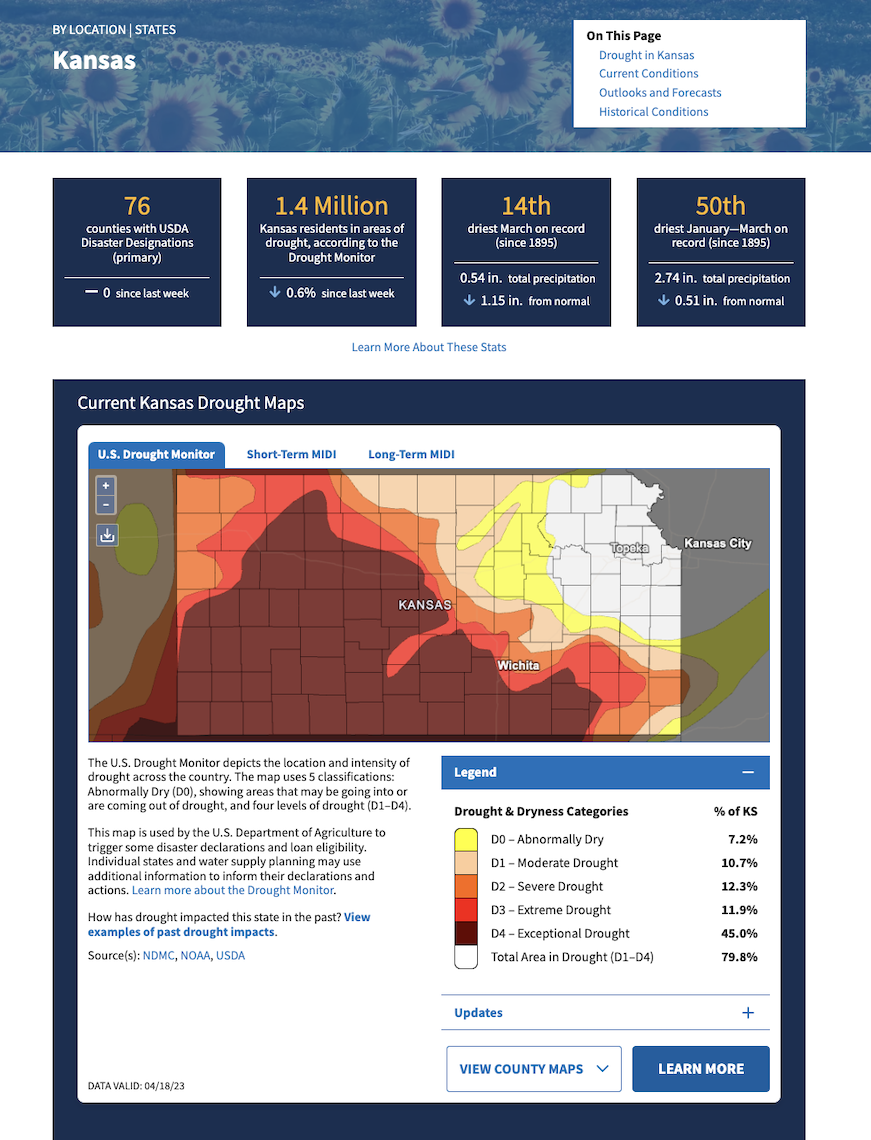
- New interactive maps featuring key drought indicators, such as precipitation, temperature, streamflow, and soil moisture, as well as outlooks and forecasts.
- Customization and sharing options for every map—just click the download button in the top left corner of any map to adjust the transparency or basemap, display county or tribal land boundaries, and download a high-quality PNG image for easy sharing.
- Historical drought information going back to the year 0 for some states. Explore interactive time series showing three historical drought datasets: the U.S. Drought Monitor, a 9-month Standardized Precipitation Index, and a reconstructed Palmer Modified Drought Index using paleoclimate data. Download historical data for your state as an image, CSV, XML, or JSON file.
- High-level, easily shareable statistics on drought and precipitation conditions for your state.
- Improved usability and page performance on desktop and mobile, including updated map and legend functionality.
- Highlighted state drought resources, directing users to reliable information from state agencies, state climatologists, agricultural extensions, and more.
- An educational overview of drought conditions in the region, emphasizing how drought onset and impacts vary by location.
- Resources to stay up to date on drought information, including NIDIS’ regional Drought Early Warning Systems (DEWS), monthly drought & climate webinars, local drought alerts, email newsletters, and regional drought status updates.
- Easy access to county-level data and maps.
These state pages will make it easier for public- and private-sector decision makers, concerned citizens, and the media to learn and communicate about drought in their state, access key state drought resources, and make actionable decisions to improve their communities’ long-term drought resilience.
To access the new state pages, visit the “By Location” section of drought.gov, then select a state or U.S. territory from the dropdown menu. Or, explore drought in other geographic regions, such as by county or HUC2 watershed.
Want to learn more about Drought.gov’s state pages? Contact the U.S. Drought Portal team with questions or feedback at drought.portal@noaa.gov.