Throwback Thursday: Texas Story Map Recalling State's Historic Drought
 Click Here to View the Story Map
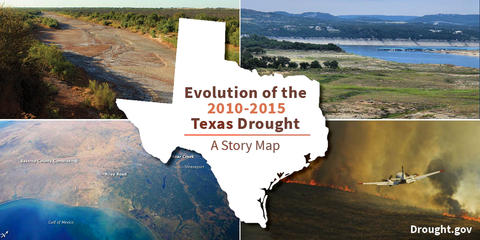
Severe drought once again has come to Texas, bringing with it memories of the state's historic and devastating drought from 2010 to 2015. As folks wait to see what will happen during this year's drought, now is a good time to revisit a Story Map developed by NIDIS and NOAA Climate Office’s Modeling, Analysis, Predictions and Projections program (MAPP). This story map is an interactive presentation that analyzes and explains the 2010-2015 Texas drought, while taking users through a visual history of the drought, using images and graphs to provide an interactive and engaging experience. This story map, developed with the collaboration of the National Drought Mitigation Center (NDMC), Texas State Climatologist John Nielsen-Gammon, and NOAA’s Earth System Research Laboratory (ESRL), was originally published last summer in July 2017.
Story maps are an emerging communications tool that allows scientists to share data, impacts, and outlooks in a way that is visually engaging for a broad range of audiences. From climate scientists to high school students, the story maps provide a customizable experience in which users can select what information they see and how in-depth they can dive into the data. MAPP and NIDIS collaborated on this Texas Story Map to tell the story of this historic drought in a way that is informative and interesting to all audiences. After the succesful launch of the Californa Drought Story Map last month, NIDIS partners expressed the incredible value in the Texas Story Map, given the extreme to exceptional drought affecting the state, and on this Throwback Thursday, we are “re-releasing” the Texas Story Map.