An official website of the United States government
Here’s how you know
The .gov means it’s official.
Federal government websites often end in .gov or .mil. Before sharing sensitive information, make sure you’re on a federal government site.
The site is secure.
The
https://
ensures that you are connecting to the official website and that any information you provide is encrypted and transmitted securely.
Western Snow Season 2022-23 Preview: A Look at Water Supplies and the Winter Outlook in 10 Maps
Published on
Author
Author: NOAA/NIDIS
Read Length
Read Time: 6 minutes
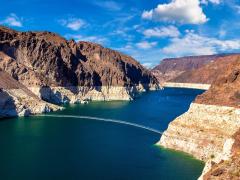
It’s hard to overstate how crucial this snow season is for the western United States. Regions such as the West that receive a great deal of their precipitation in the form of snow face a number of challenges when snow droughts occur, including shrinking water supplies. And western water supplies are truly shrinking as some states are facing their second or third drought year in a row and a large part of the region is stuck in a 20+ year megadrought. Hanging over all of this is climate change–influenced aridification in the Southwest that is increasing evaporative demand, causing water supplies to dwindle from rising temperatures even when there is adequate precipitation. The two largest reservoirs in the U.S., Lake Mead and Lake Powell, are currently at the lowest levels since they were filled: both are below 30% of capacity. The two largest reservoirs in California, Lake Shasta and Lake Oroville, are at 31% and 27% of capacity, respectively.
Adding to the concerns this winter is that NOAA’s Climate Prediction Center's seasonal outlook favors drier and warmer conditions for the southern part of the region, mostly based on a continuing La Niña pattern. This would be the third winter La Niña in a row for the United States.
The maps included here show how previous La Niña winters have impacted precipitation and temperature across the U.S., the latest National Weather Service outlooks that are influenced by these past La Niña events, and the water supply issues in the West, which will be greatly exacerbated if the winter outlooks come to fruition. Lastly, the latest snow conditions in the West are included, although it’s very early to draw any conclusions from them.
Want to stay informed this snow season? NIDIS and its partners issue snow drought updates every 4 weeks from mid-December through June. Subscribe to Dry Times, NIDIS’s bi-weekly email newsletter, for the latest snow drought updates.
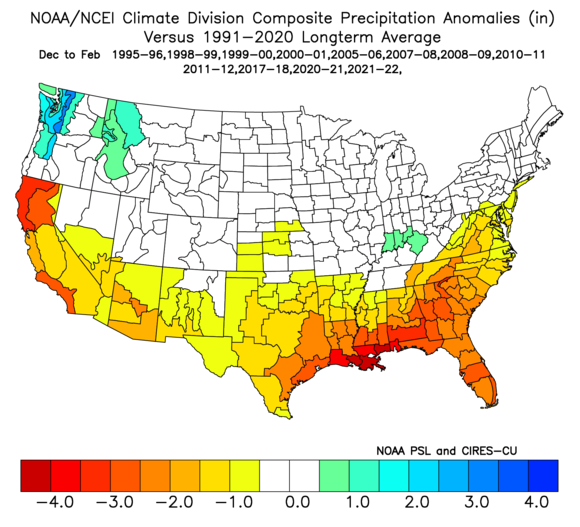
La Niña Impacts on Precipitation and Temperature
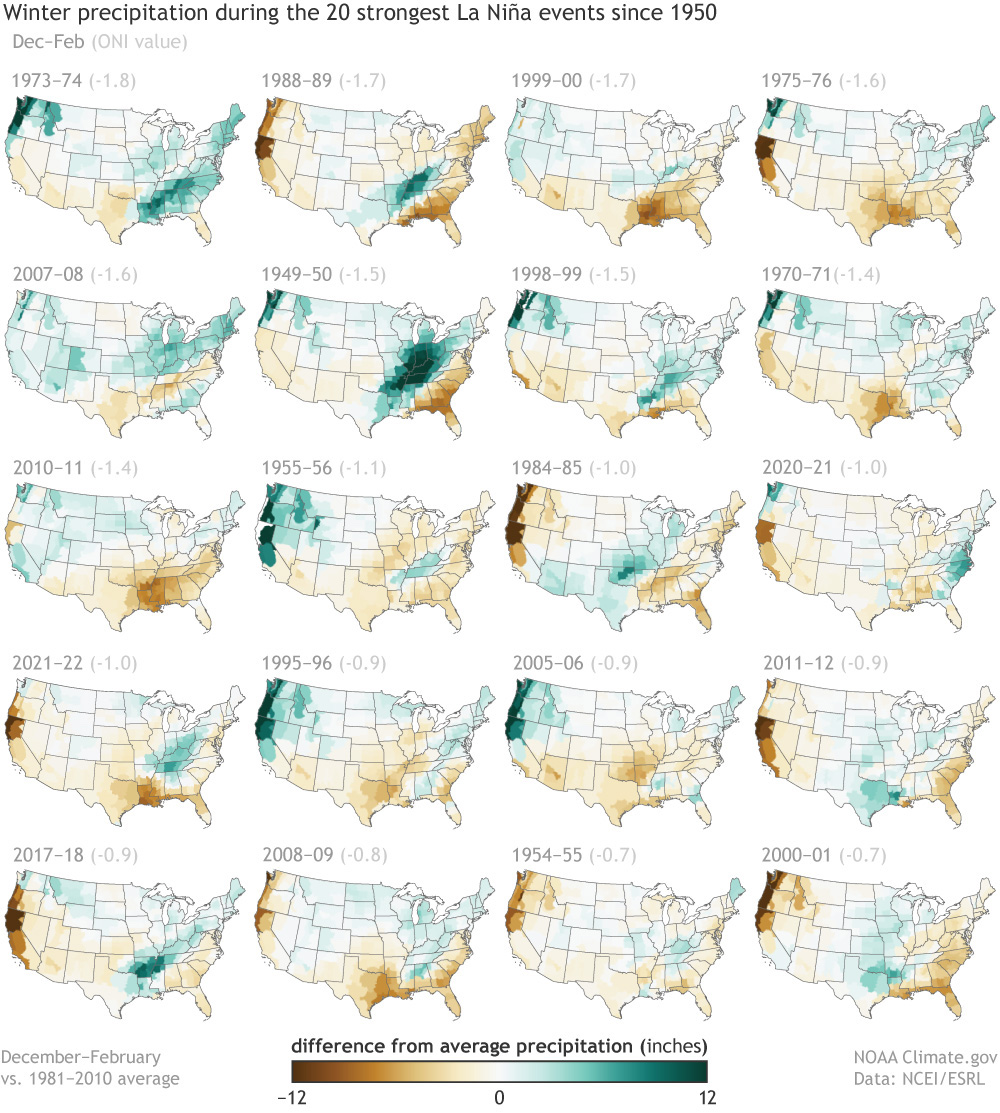
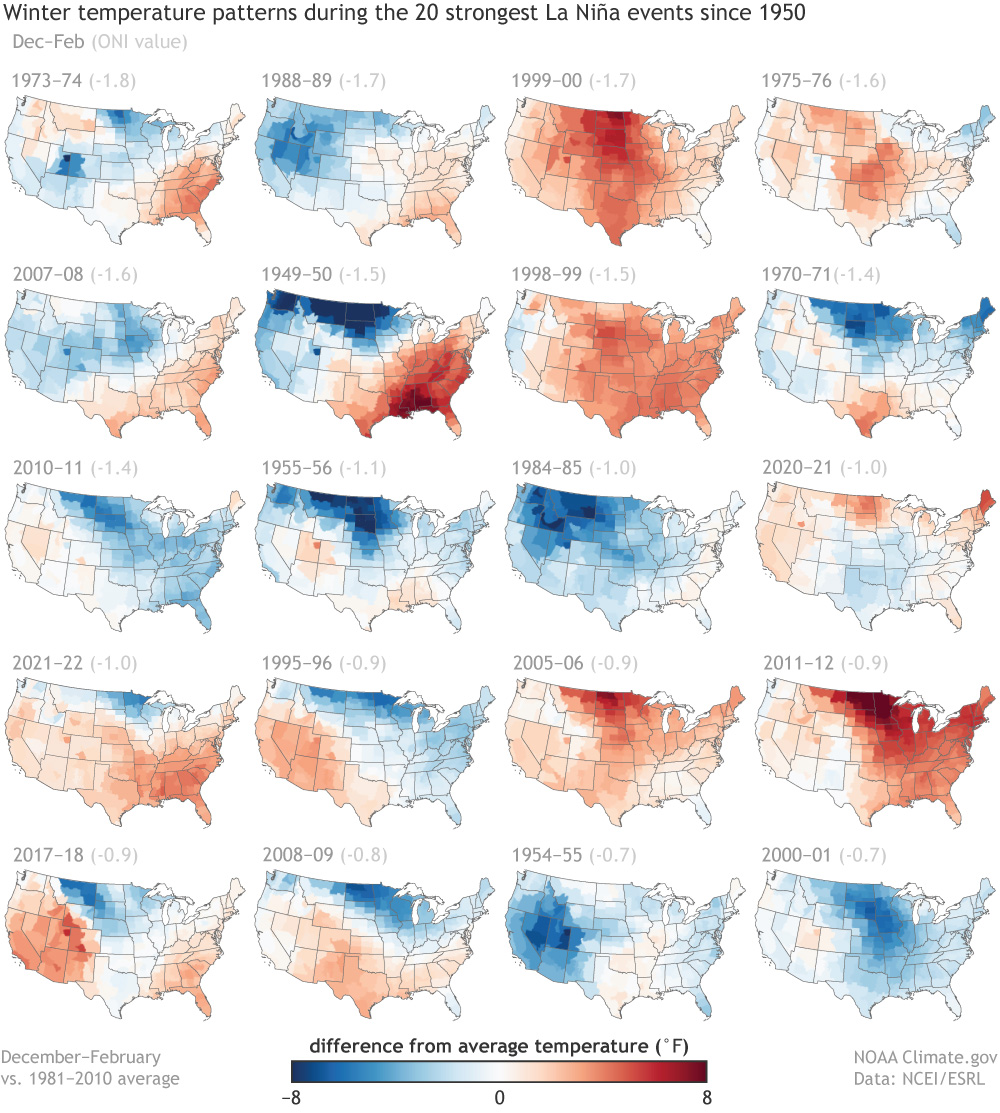
Figure 1: This image includes all La Niña events during the December-January-February (DJF) time period (12 total) going back to 1990, and compares the observed precipitation during the DJF time period with the 1991–2020 long-term average. As shown, the southern U.S. from coast to coast has had below-average precipitation for all the La Nina years put together. Parts of the Pacific Northwest and the Midwest have had above-average precipitation. Source: NOAA/NCEI data compiled by Victor Murphy with the National Weather Service Southern Region Headquarters.Figure 2: Winter precipitation patterns during each of the 20 strongest La Niña episodes since 1950. The strength is measured by the December–February Oceanic Niño Index (ONI), which is three-month average surface temperature departure from normal in the Niño 3.4 region. The December–February ONI for each episode is shown in parentheses (units of °C) above each map. The strongest La Niña episode is on the top left, and the weakest of the 20 episodes is on the bottom right. Source: NOAA Climate.gov, based on NCEI climate division data provided by NOAA's Physical Sciences Laboratory.Figure 3: Winter temperature patterns during each of the 20 strongest La Niña episodes since 1950. The strength is measured by the December–February Oceanic Niño Index (ONI), which is the three-month average surface temperature departure from normal in the Niño 3.4 region. The December–February ONI for each episode is shown in parentheses (units of °C) above each map. The strongest La Niña episode is on the top left, and the weakest of the 20 episodes is on the bottom right. Source: NOAA Climate.gov, based on NCEI climate division data provided by NOAA's Physical Sciences Laboratory.
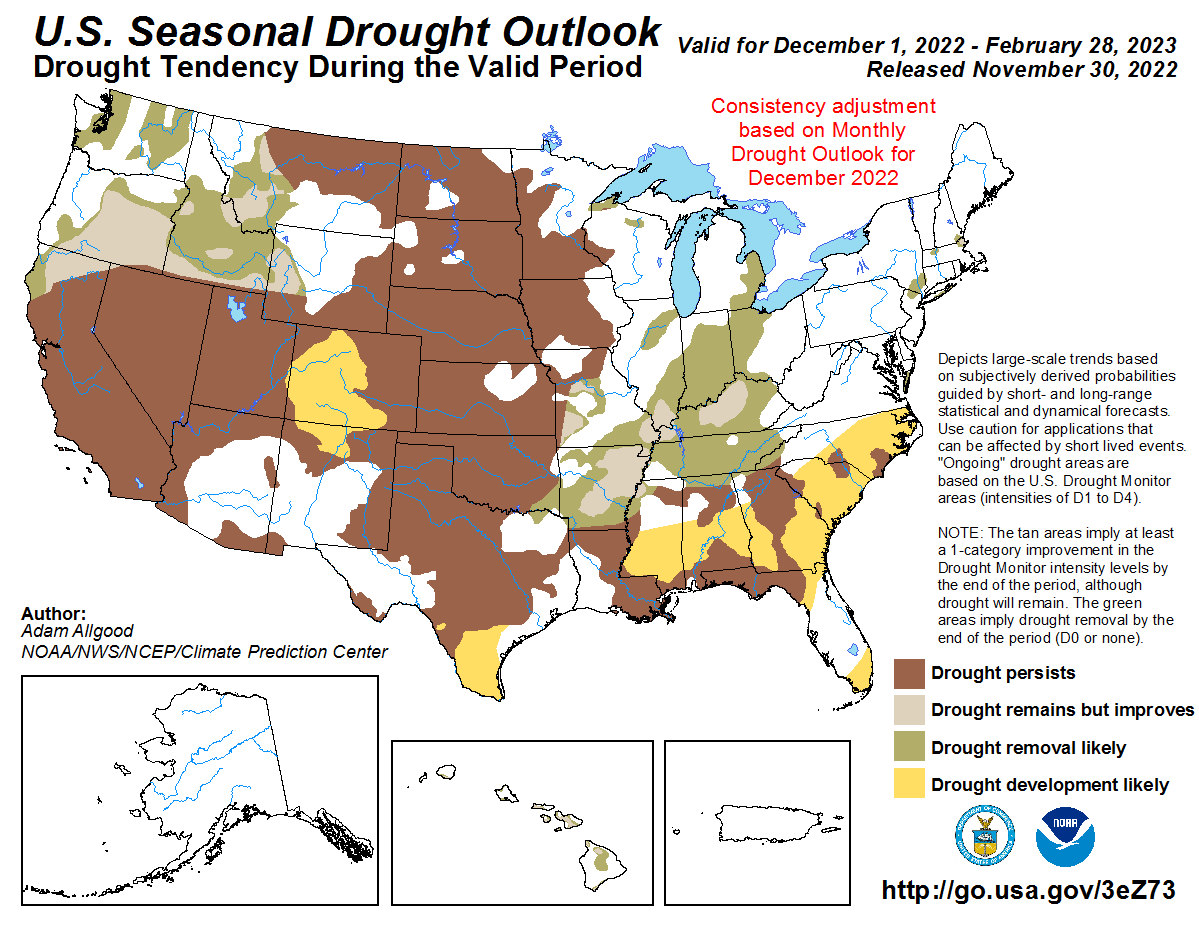
National Weather Service/Climate Prediction Center's Seasonal and Monthly Outlooks
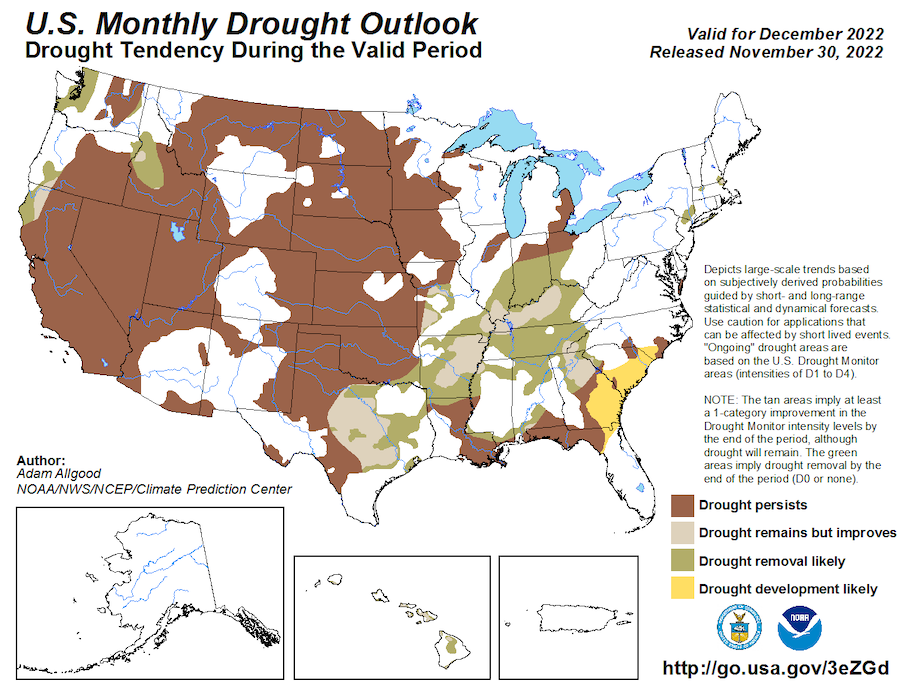
Figure 4: The seasonal drought outlook shows that a below-average peak wet season is anticipated for central to southern California and the Southwest, favoring drought persistence, while drought reductions are favored for the Northwest and northern Intermountain West. Little additional drought development is forecast for the Four Corners region due to lingering effects from a robust summer monsoon, though some development is favored for Colorado and northern New Mexico where initial conditions are considerably drier. Source: NWS Climate Prediction Center.Figure 5: The December drought outlook calls for increased chances of above-normal precipitation throughout the northwest quarter of the contiguous U.S., supporting drought removal or improvement for the Pacific Northwest, parts of northern California, and the northern Rockies through the end of December. For the remainder of the West, long-term drought is most likely to persist on a monthly time scale. Source: NWS Climate Prediction Center.
Western Water Supplies
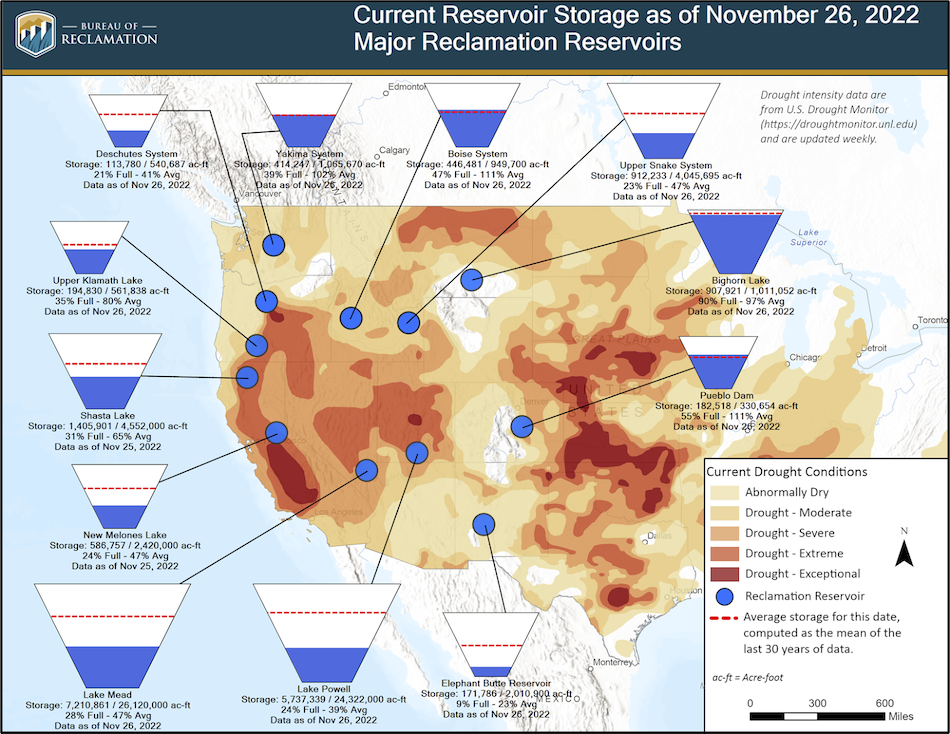
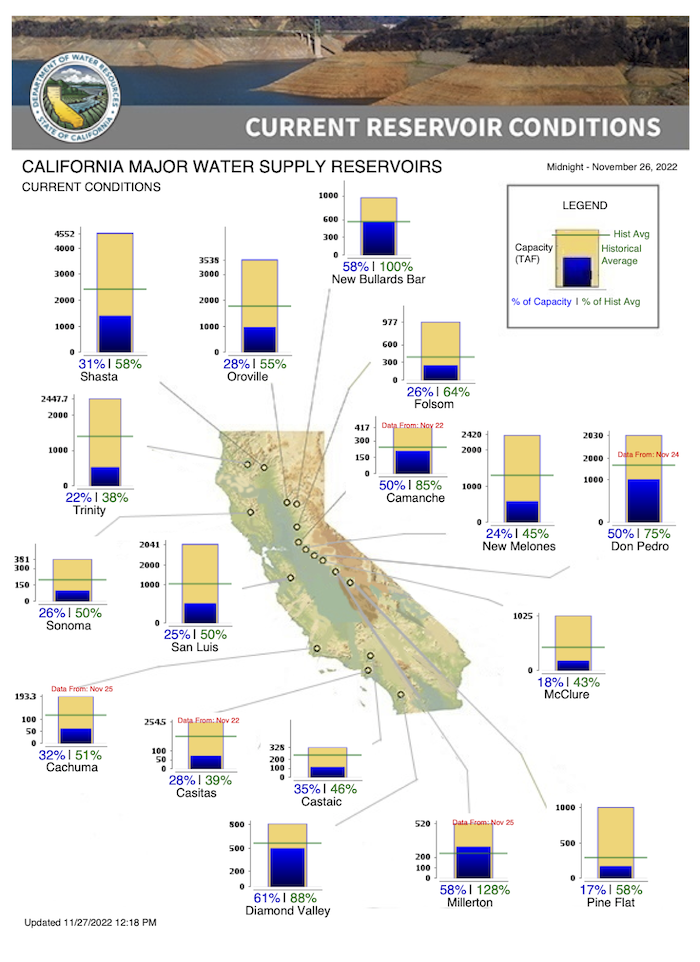
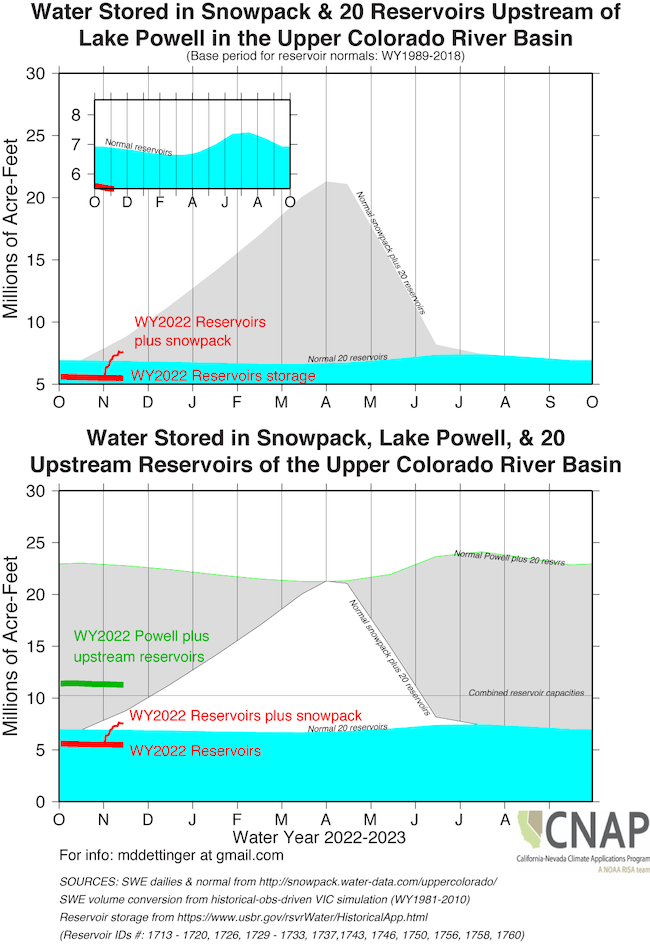
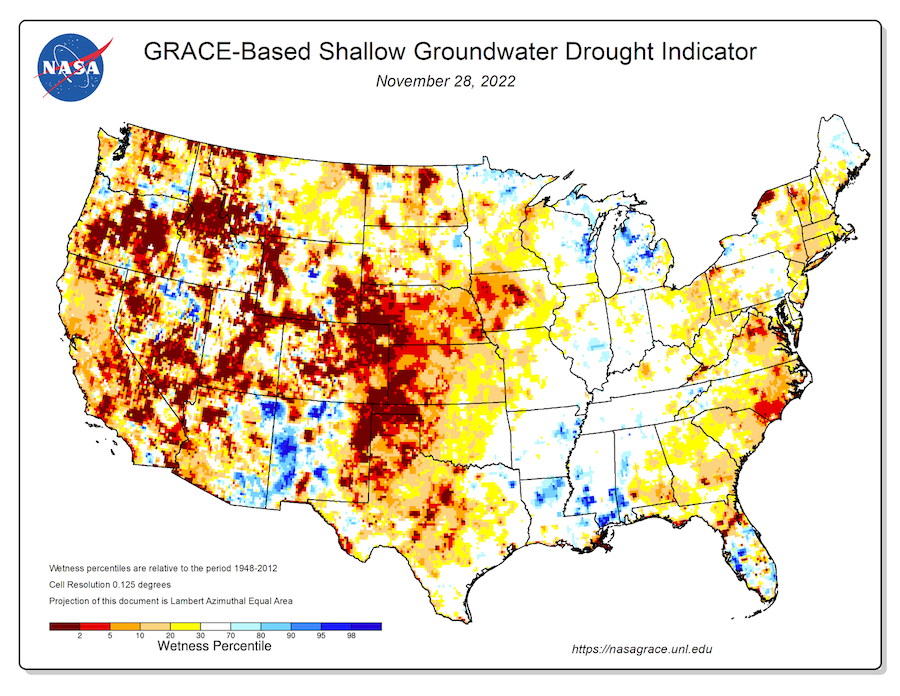
Figure 6: Drought conditions across the West dating back to 2020 and earlier have had a substantial impact on storage levels for many of the Bureau of Reclamation’s reservoirs. With most facilities realizing below average inflows in the last two water years, storage across the West is also below average at many facilities. Across the West, multiple reservoirs have reached 30-year storage lows, including Lakes Mead and Powell. Source: U.S. Bureau of Reclamation.Figure 7: Long-term drought in California has left 15 of 17 major water supply reservoirs below their historical averages. Shasta, the largest reservoir in the state, is at 58% of average and only 31% of capacity. Source: California Department of Water Resources.Figure 8: These graphics show the amount of water (in millions of acre-feet) stored in 20 long-reporting reservoirs above Lake Powell in the Upper Colorado River Basin, in snowpack above Lake Powell, and in Lake Powell. Lake Powell storage capacity is considerably greater than the total storage in the 20 reservoirs considered here, and is comparable to the long-term average yearly maximum volume of water stored in the snowpacks of the UCRB. Source: California Nevada Adaptation Program (a NOAA CAP/RISA team).Figure 9: Scientists at NASA’s Goddard Space Flight Center generate groundwater indicators each week. They are based on terrestrial water storage observations derived from NASA GRACE-FO satellite data and integrated with other observations, using a sophisticated numerical model of land surface water and energy processes. The drought indicators describe current wet or dry conditions, expressed as a percentile showing the probability of occurrence for that particular location and time of year, with lower values (warm colors) meaning drier than normal, and higher values (blues) meaning wetter than normal. As shown on the map, shallow groundwater levels are low throughout most of the West. Source: NASA, University of Nebraska – Lincoln.
Latest Snow Drought Conditions
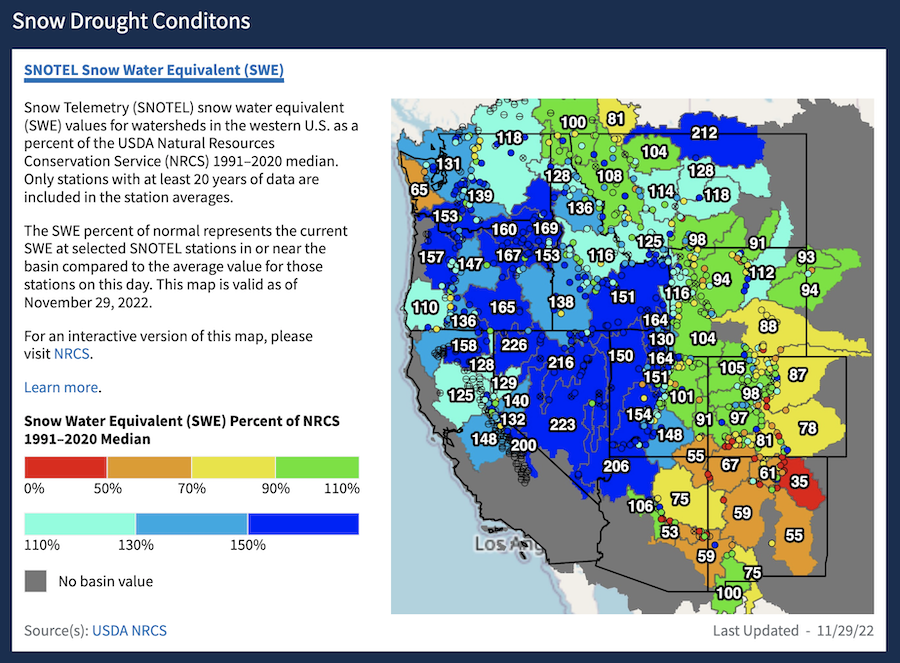
Figure 10: Snow Telemetry (SNOTEL) snow water equivalent (SWE) values for watersheds in the western U.S. as a percent of the USDA Natural Resources Conservation Service (NRCS) 1991–2020 median. Most of the the West has had a strong start in SWE, with only the southeastern parts of the West and a few other spots below median. But it's too early in the snow season to draw conclusions. This map is valid as of November 29, 2022. Source: USDA NRCS.