U.S. flag

An official website of the United States government

NEWS ARCHIVE

Browse news articles

Published Date Between
Search Results(145)
Published on

In March, June, September, and December, NOAA’s Regional Climate Services Programs create Climate and Drought Outlook documents to inform the public about recent climate impacts within their respective regions. This effort, which began in 2012, now includes as many as 10 unique regional products, all produced collaboratively with partner organizations. Each regional report contains easy-to-understand language and is available to anyone.

Published on

Maps highlighting the effects of drought on six agricultural commodities across the continental U.S. are now available on a website hosted by the National Drought Mitigation Center at the University of Nebraska-Lincoln. The maps are a collaboration between the U.S. Department of Agriculture’s Office of the Chief Economist and the drought center.

Published on

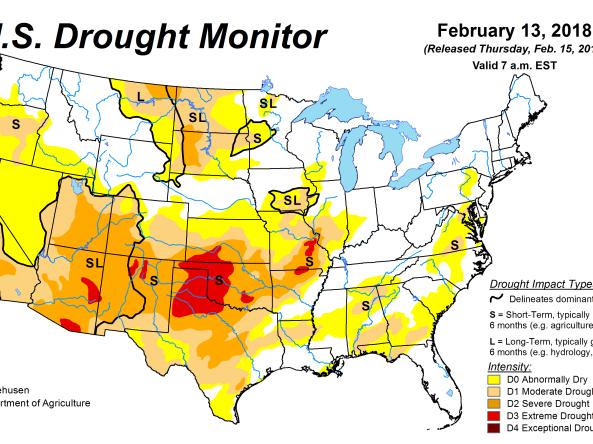
Drought coverage across the country has progressively declined over the past several months, as assessed by the U.S. Drought Monitor. At the end of November 2016, drought encompassed more than one-quarter of the nation. That number dropped below 12 percent at the end of March 2017, and to 4.2 percent in early May, the least coverage since Drought Monitor statistics were first calculated at the beginning of 2000.

Published on

Each week, the Colorado Climate Center assembles an assessment of drought-related conditions in the five-state region of Colorado, Wyoming, Utah, Arizona, and New Mexico. Data, maps, and summaries consider precipitation, snowpack, streamflow, surface water, evaporative demand, temperature, and outlooks for the next week through three months.

Published on

The Sub-Seasonal Climate Forecast Rodeo is a year-long, real-time forecasting competition focused on western U.S. temperature and precipitation for weeks 3&4 and weeks 5&6. The Bureau of Reclamation is sponsoring the competition in partnership with NOAA, USGS, and the U.S. Army Corps of Engineers. Contestants submit forecasts every other week, and these are evaluated as observed data become available.