Climate Prediction Center Soil Moisture Products
National Weather Service (NWS) Climate Prediction Center (CPC)
This suite of products from the National Weather Service's Climate Prediction Center provides soil moisture conditions in the U.S. at the daily and monthly scales, including total soil moisture, percentiles and anomalies, monthly and seasonal change, and outlooks.
Soil moisture is estimated by a one-layer Leaky Bucket hydrological model. The model takes as forcing observed precipitation and temperature and calculates soil moisture, evaporation, runoff, and snowpack (global daily version). The potential evaporation is estimated from observed temperature. Model parameters are constant spatially and tuned to reproduce runoff of several small river basins in eastern Oklahoma. This resulted in a maximum holding capacity of 760mm (or 29.9 inches) of water. Along with a common porosity of 0.47 this implies a soil column of 1.6 meter (=5.25 ft).
The hydrological model runs in two different configurations:
- Daily and monthly updates over the contiguous U.S. (CONUS): The daily soil moisture dataset in the current month is calculated with real-time daily precipitation and temperature from CPC in-house products with one-day lag. The observed monthly precipitation and temperature datasets over 344 Climate Divisions are from NOAA's National Centers for Environmental Information (1895–present) and are usually available on the 5th of the current month.
- Daily and monthly updates over the global (0.5x0.5 degree resolution) domain: The daily (1979–present) and monthly (1948–present) global soil moisture datasets are calculated with the observed CPC Unified Global Precipitation Analysis and CPC global surface air temperature analysis with one-day lag. The monthly update is usually available around the 5th of the current month.
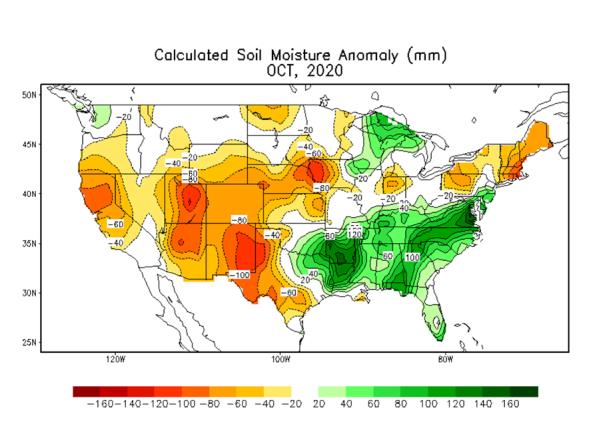
Anomalies are defined as deviations from the 1991–2020 daily or monthly climatology. Percentiles are based on the period from 1895 (344 U.S. Climate Divisions) or 1979/1948 (global domain) to the most recent soil moisture records.
This map shows U.S. soil moisture percentiles at a 1.6 meter depth, as estimated by the National Weather Service's Climate Prediction Center (CPC). Soil moisture is estimated using a one-layer Leaky Bucket hydrological model. This model takes as forcing observed precipitation and temperature and calculates soil moisture, evaporation, runoff and snowpack. The daily CONUS soil moisture dataset is calculated with real-time daily precipitation and temperature from CPC in-house products with a 1-day delay. Soil moisture percentiles are based on the period from 1895 to the most recent soil moisture records. Learn more.
Soil moisture data from the National Weather Service's Climate Prediction Center were available in GeoTIFF format. GIS software used the GeoTIFF format to create the map tiles used on Drought.gov.
Calculated Soil Moisture Ranking Percentile
This map shows U.S. soil moisture percentiles at a 1.6 meter depth, as estimated by the National Weather Service's Climate Prediction Center (CPC). Soil moisture is estimated using a one-layer Leaky Bucket hydrological model. This model takes as forcing observed precipitation and temperature and calculates soil moisture, evaporation, runoff and snowpack. The daily CONUS soil moisture dataset is calculated with real-time daily precipitation and temperature from CPC in-house products with a 1-day delay. Soil moisture percentiles are based on the period from 1895 to the most recent soil moisture records. Learn more.
Soil moisture data from the National Weather Service's Climate Prediction Center were available in GeoTIFF format. GIS software used the GeoTIFF format to create the map tiles used on Drought.gov.
How to
What can I do with these data?
- Check soil moisture conditions at the daily and monthly scale.
How do I use the site?
- Click or roll your cursor over the names/labels of the products to view the maps.
- To enlarge image, right-click the map and select “View Image.” To save image, right-click the map and select “Save Image As...”
Access
Soil moisture maps: depicting soil moisture totals, percentiles, anomalies and change
Soil moisture GIS data: FTP link to GIS data for soil moisture totals, percentiles and anomalies via FTP
Metadata