NationalSoilMoisture.com
National Oceanic and Atmospheric Administration (NOAA), National Integrated Drought Information System (NIDIS), United States Geological Survey (USGS), United States Department of Agriculture (USDA), The Ohio State University, Texas A&M University
The research-based website NationalSoilMoisture.com provides high-resolution gridded soil moisture products derived from in situ soil moisture measurements, Natural Resources Conservation Service SSURGO soil characteristics, and PRISM data. The project combines data from multiple federal, regional, and state agencies to create comprehensive data products for the United States, including Alaska, Hawaii, and Puerto Rico. These products include near real-time soil moisture percentiles derived from in situ data, modeled NLDAS data, and NASA’s Soil Moisture Active Passive (SMAP) satellite, as well as a near real-time blended product.
The website provides soil moisture maps for 5 cm, 20 cm and 50 cm depths. They are updated every day based on current soil moisture conditions. Soil water content is reported as a percentile (from 0 to 100). The percentiles are calculated based on the historical record, and they compare the soil water content to the historical distribution of soil water content at that location and in that month.
This project is a joint effort between the National Oceanic and Atmospheric Administration (NOAA), NOAA National Integrated Drought Information System (NIDIS), the United States Geological Survey (USGS) Center for Integrated Data Analytics (CIDA), the United States Department of Agriculture (USDA), The Ohio State University, and Texas A&M University. It is one of the key exploratory research projects under the National Coordinated Soil Moisture Monitoring Network.
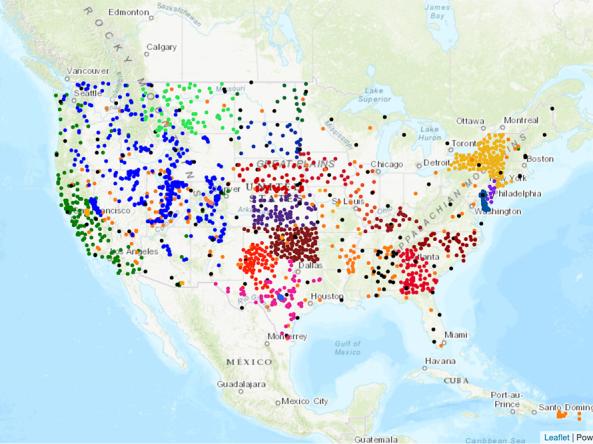
This map shows the moisture content of the top 20 cm of soil compared to historical conditions, based on in situ (in the ground) measurements of soil moisture from a wide range of state and federal mesonets across the continental U.S. These data are then interpolated into a 4 km grid.
Red and orange hues indicate drier soils, while greens and blues indicate greater soil moisture.
20 cm Soil Moisture Percentile
0–2nd Percentile
Soil moisture at 20cm depth is in the bottom 2% (0–2nd percentile) of historical measurements for this day of the year.
2nd–5th Percentile
Soil moisture at 20cm depth falls between the 2nd to 5th percentile of historical measurements for this day of the year.
5th–10th Percentile
Soil moisture at 20cm depth falls between the 5th to 10th percentile of historical measurements for this day of the year.
10th–20th Percentile
Soil moisture at 20cm depth falls between the 10th to 20th percentile of historical measurements for this day of the year.
20th–30th Percentile
Soil moisture at 20cm depth falls between the 20th to 30th percentile of historical measurements for this day of the year.
30th–70th Percentile
Soil moisture at 20cm depth falls between the 30th to 70th percentile of historical measurements for this day of the year.
70th–80th Percentile
Soil moisture at 20cm depth falls between the 70th to 80th percentile of historical measurements for this day of the year.
80th–90th Percentile
Soil moisture at 20cm depth falls between the 80th to 90th percentile of historical measurements for this day of the year.
90th–95th Percentile
Soil moisture at 20cm depth falls between the 90th to 95th percentile of historical measurements for this day of the year.
95th–98th Percentile
Soil moisture at 20cm depth falls between the 95th to 98th percentile of historical measurements for this day of the year.
98th–100th Percentile
Soil moisture at 20cm depth is in the top 2% (98th to 100th percentile) of historical measurements for this day of the year.
This map shows the moisture content of the top 20 cm of soil compared to historical conditions, based on in situ (in the ground) measurements of soil moisture from a wide range of state and federal mesonets across the continental U.S. These data are then interpolated into a 4 km grid.
Red and orange hues indicate drier soils, while greens and blues indicate greater soil moisture.
Soil moisture data are updated daily, with a 1-day delay due to differences in network report timing.
How to
What can I do with these data?
- Check current and past soil moisture percentiles and soil temperature back to 2018. Both station-based and interpolated datasets are available.
How do I use the site?
- Web Maps: navigate to the “Maps” tab and select a current conditions data product that you would like to be visualized. An interactive map will generate and allow you to zoom in/out, pan, and select specific data points for more information.
- Other Resources: View more information about the project, team, data inputs, methodology, data access, and related research in the tabs at the top of the website.
Access
Data Directory: Download a CSV file of all stations. Interpolated data products (in GeoTIFF format) are available upon request using the contact email provided on the main web page.
RK 20 cm Soil Moisture Percentile: This high-resolution gridded soil moisture map shows soil moisture percentiles at 20 cm depth, derived from merging in situ soil moisture data from a wide range of state and federal mesonets across the continental U.S. and interpolating these data into a 4 km grid via Regression Kriging (RK). Data are updated daily with a 1-day delay due to differences in network report timing.
5 cm All Blend: This 5 cm All Blend is computed using a simple average to combine 5 cm interpolated in situ volumetric water content (VWC) percentiles, NLDAS Noah 0-10 cm VWC percentiles, and Soil Moisture Active Passive (SMAP) L3 enhanced VWC percentiles (~5 cm). To match the NLDAS output time step, the All Blend is generated at a 5-day latency.
Documentation
About NationalSoilMoisture.com: View information on methodology, datasets, and contributing soil moisture networks