Quarterly Climate Impacts and Outlook for the Northeast Region for June – August 2017. Dated September 2017.
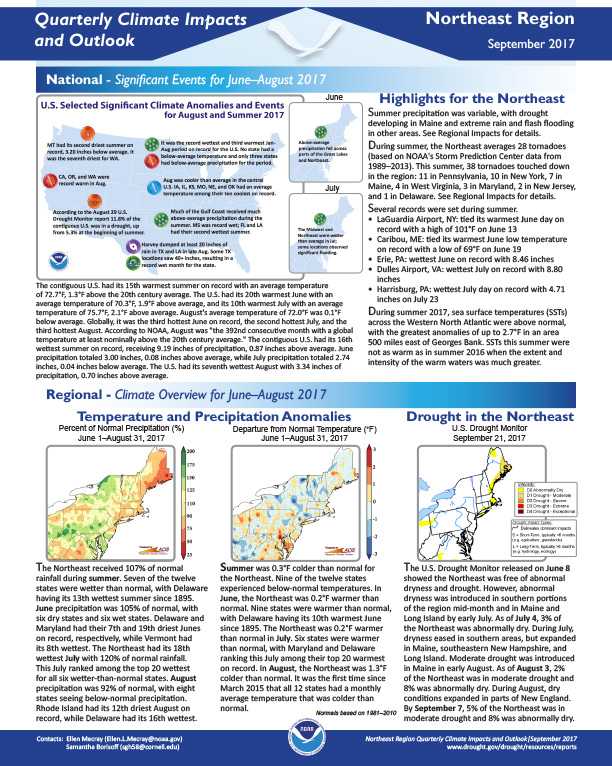
Summer precipitation was variable, with drought developing in Maine and extreme rain and flash flooding in other areas. During summer, the Northeast averages 28 tornadoes (based on NOAA's Storm Prediction Center data from 1989–2013). This summer, 38 tornadoes touched down in the region: 11 in Pennsylvania, 10 in New York, 7 in Maine, 4 in West Virginia, 3 in Maryland, 2 in New Jersey, and 1 in Delaware.

Quarterly Climate Impacts and Outlook for the Southeast Region for June – August 2017. Dated September 2017.
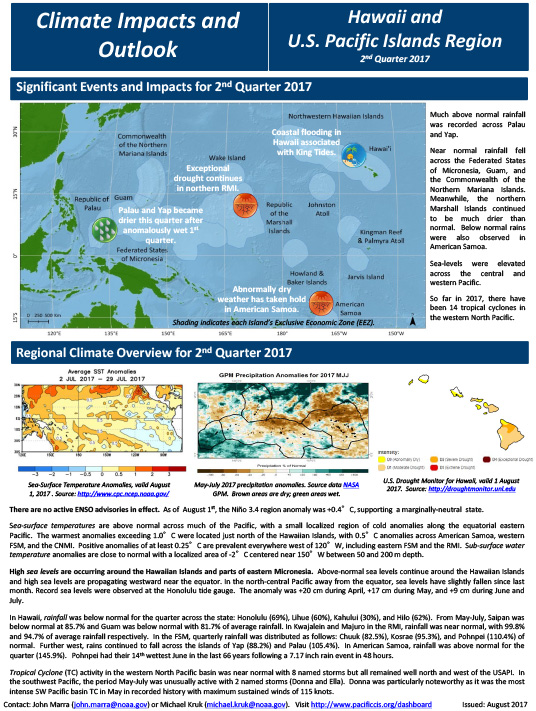
Quarterly Climate Impacts and Outlook for the Hawaii and the U.S. Pacific Islands Region for May – July 2017. Dated August 2017.
Includes significant events and impacts for Q2 2017; regional climate overview; sectoral impacts, and regional outlook for August through October 2017.
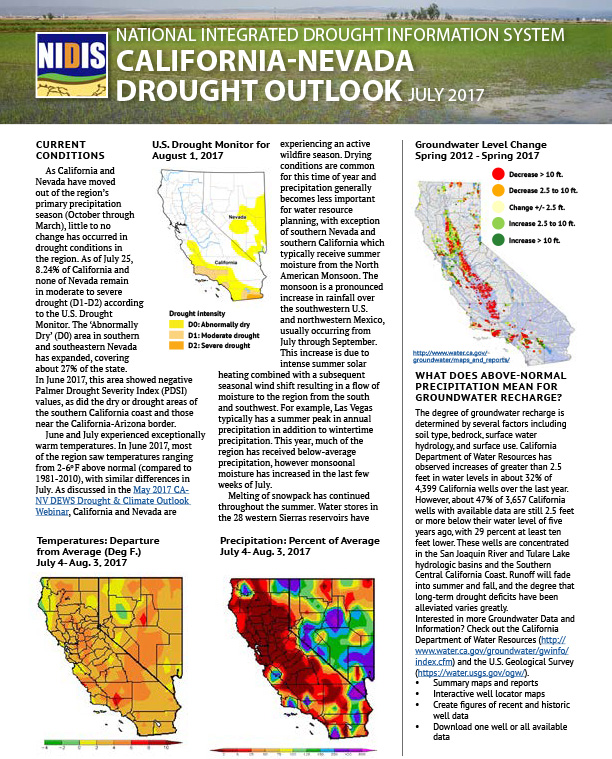
Current conditions as of July 2017; climate outlook. Information about CAL-Adapt and how CNAP is providing drought scenarois for it, as well as a short section on “What does above-normal precipitation mean for groundwater recharge?”
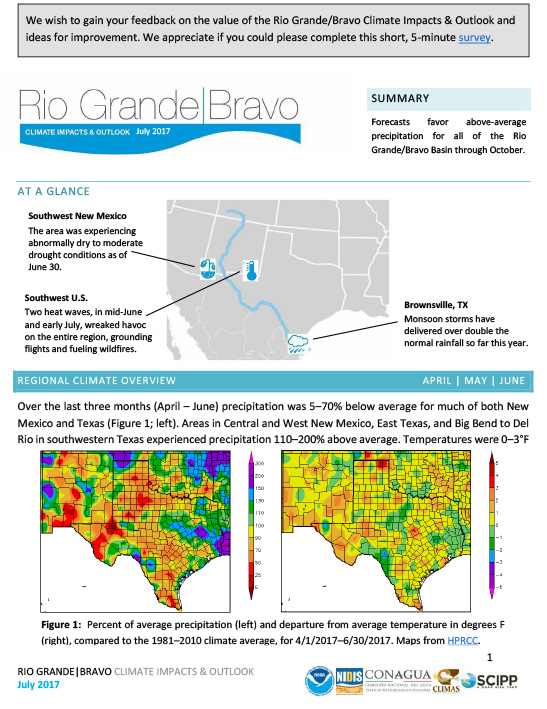
Summary of current conditions, climate outlook, and fire potential for the Rio Grande-Bravo region of the United States.

Quarterly Climate Impacts and Outlook for Alaska and Northwestern Canada for March – May 2017; outlook for July – September 2017. Dated June 2017.
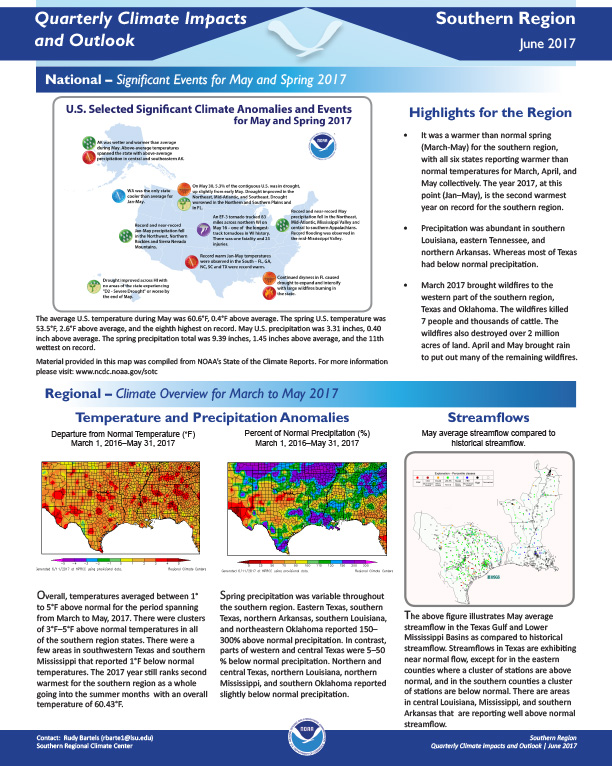
Quarterly Climate Impacts and Outlook for the Southern Region for March – May 2017. Dated June 2017.
It was a warmer than normal spring (March-May) for the southern region, with all six states reporting warmer than normal temperatures for March, April, and May collectively. The year 2017, at this point (Jan–May), is the second warmest year on record for the southern region.
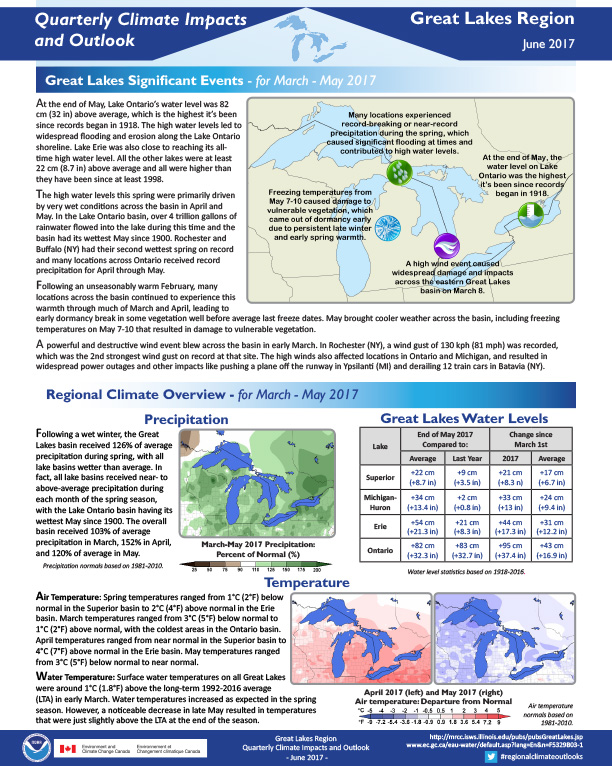
Quarterly Climate Impacts and Outlook for the Great Lakes Region for March – May 2017. Dated June 2017.
At the end of May, Lake Ontario’s water level was 82 cm (32 in) above average, which is the highest it’s been since records began in 1918. The high water levels led to widespread flooding and erosion along the Lake Ontario shoreline. Lake Erie was also close to reaching its all-time high water level. All the other lakes were at least 22 cm (8.7 in) above average and all were higher than they have been since at least 1998.
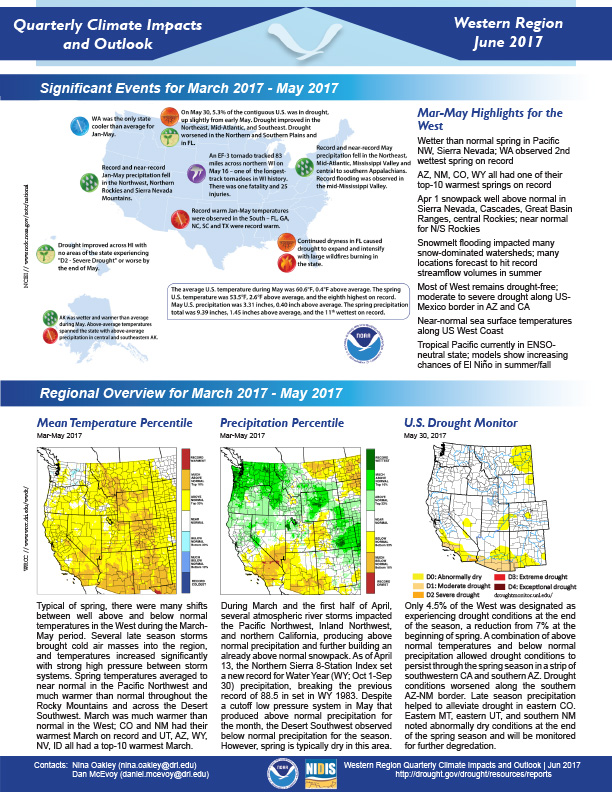
Quarterly Climate Impacts and Outlook for the Western Region for March – May 2017. Dated June 2017.

Quarterly Climate Impacts and Outlook for the Missouri River Basin March – May 2017. Dated June 2017.
Overall, it was a warm spring with each state in the above to much above average range. Colorado and Wyoming were ranked highest in the region as the 8th warmest on record. Spring precipitation was varied with Missouri and Kansas ranking as the top 4th and 5th wettest, respectively, and North Dakota ranking as the 9th driest.