Low snowpack drives worsening drought in the Intermountain West
Key Points
- Winter was extremely dry for Arizona, New Mexico, southern Colorado and Utah, and parts of Wyoming.
- Arizona statewide snow water equivalent (SWE) for December 2024–February 2025 is comparable to 2006 SWE, which was the driest on record.
- Snow drought impacted spring runoff and future water supply for the Upper San Juan, Upper Rio Grande, and Gunnison River Basins.
- The National Weather Service Climate Prediction Center’s outlooks favor warmer conditions for the whole region and drier conditions for Arizona and New Mexico, which may increase wildfire risk.
This update is based on data available as of Thursday, March 20, 2025 at 8:00 a.m. MT. We acknowledge that conditions are evolving.
The U.S. Drought Monitor depicts the location and intensity of drought across the country. The map uses 5 classifications: Abnormally Dry (D0), showing areas that may be going into or are coming out of drought, and four levels of drought (D1–D4).
The U.S. Drought Monitor is a joint effort of the National Oceanic and Atmospheric Administration, U.S. Department of Agriculture, and National Drought Mitigation Center.
A drought index combines multiple drought indicators (e.g., precipitation, temperature, soil moisture) to depict drought conditions. For some products, like the U.S. Drought Monitor, authors combine their analysis of drought indicators with input from local observers. Other drought indices, like the Standardized Precipitation Index (SPI), use an objective calculation to describe the severity, location, timing, and/or duration of drought.
Learn MorePeriods of drought can lead to inadequate water supply, threatening the health, safety, and welfare of communities. Streamflow, groundwater, reservoir, and snowpack data are key to monitoring and forecasting water supply.
Learn MoreDrought can reduce the water availability and water quality necessary for productive farms, ranches, and grazing lands, resulting in significant negative direct and indirect economic impacts to the agricultural sector. Monitoring agricultural drought typically focuses on examining levels of precipitation, evaporative demand, soil moisture, and surface/groundwater quantity and quality.
Learn MoreU.S. Drought Monitor Categories
D0 - Abnormally Dry
Abnormally Dry (D0) indicates a region that is going into or coming out of drought. View typical impacts by state.
D1 - Moderate Drought
Moderate Drought (D1) is the first of four drought categories (D1–D4), according to the U.S. Drought Monitor. View typical impacts by state.
D2 - Severe Drought
Severe Drought (D2) is the second of four drought categories (D1–D4), according to the U.S. Drought Monitor. View typical impacts by state.
D3 - Extreme Drought
Extreme Drought (D3) is the third of four drought categories (D1–D4), according to the U.S. Drought Monitor. View typical impacts by state.
D4 - Exceptional Drought
Exceptional Drought (D4) is the most intense drought category, according to the U.S. Drought Monitor. View typical impacts by state.
Total Area in Drought (D1–D4)
Percent area of the Intermountain West that is currently in drought (D1–D4), according to the U.S. Drought Monitor.
The U.S. Drought Monitor depicts the location and intensity of drought across the country. The map uses 5 classifications: Abnormally Dry (D0), showing areas that may be going into or are coming out of drought, and four levels of drought (D1–D4).
The U.S. Drought Monitor is a joint effort of the National Oceanic and Atmospheric Administration, U.S. Department of Agriculture, and National Drought Mitigation Center.
The U.S. Drought Monitor is released every Thursday morning, with data valid through the previous Tuesday at 7 a.m. ET.
A drought index combines multiple drought indicators (e.g., precipitation, temperature, soil moisture) to depict drought conditions. For some products, like the U.S. Drought Monitor, authors combine their analysis of drought indicators with input from local observers. Other drought indices, like the Standardized Precipitation Index (SPI), use an objective calculation to describe the severity, location, timing, and/or duration of drought.
Learn MorePeriods of drought can lead to inadequate water supply, threatening the health, safety, and welfare of communities. Streamflow, groundwater, reservoir, and snowpack data are key to monitoring and forecasting water supply.
Learn MoreDrought can reduce the water availability and water quality necessary for productive farms, ranches, and grazing lands, resulting in significant negative direct and indirect economic impacts to the agricultural sector. Monitoring agricultural drought typically focuses on examining levels of precipitation, evaporative demand, soil moisture, and surface/groundwater quantity and quality.
Learn MoreCurrent Conditions and Impacts for the Intermountain West
- 70.62% of the Intermountain West region is in drought (D1-D4), according to the U.S. Drought Monitor as of March 18, 2025. The most severe conditions are in western Arizona and southern New Mexico, where large areas of Extreme Drought (D3) and Exceptional Drought (D4) developed since the start of Water Year 2025 (October 1, 2024).
- December–-March average temperatures were above normal across much of the Intermountain West region, with the greatest anomalies observed in south-central Colorado and northern Utah.
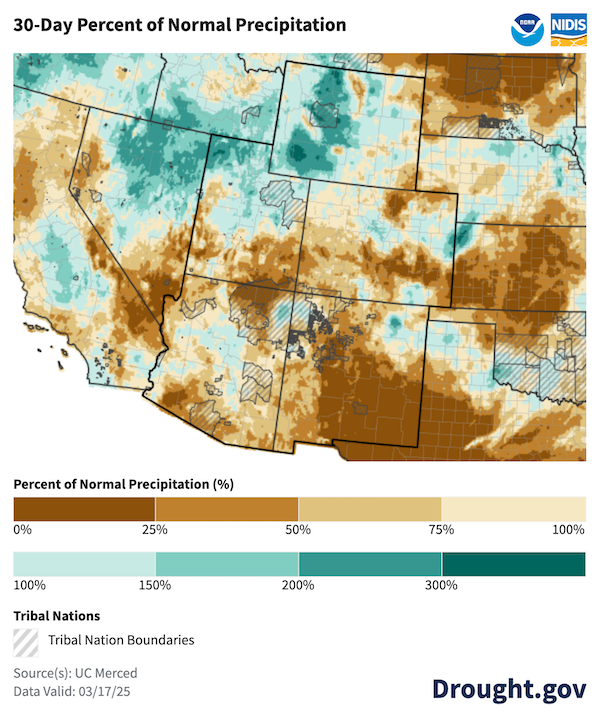
- Precipitation has been below normal—particularly across Arizona, New Mexico, southern Utah, much of Colorado, and southeastern Wyoming. Five of the eight climate divisions in New Mexico had their 1st or 2nd driest winter (December–February) on record (in 130 years), and every climate division in Arizona had one of its top 4 driest winters.
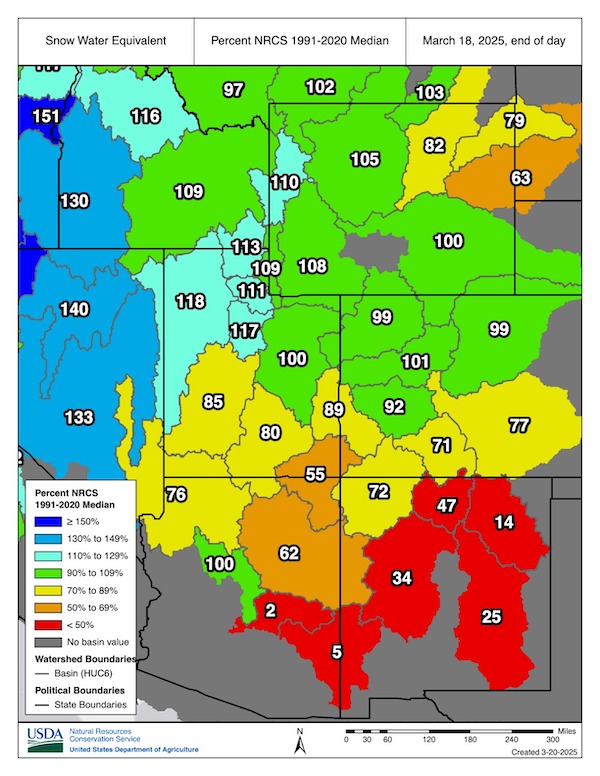
- Very poor snowpack conditions are reported across numerous river basins in the Intermountain West, with the most significant deficits in Arizona, New Mexico, and southern Utah, causing worsening drought conditions this winter. Snowpack in Wyoming and north-central Colorado improved since January 2025. Late-season storms during the first half of March boosted snowpack in isolated areas of northern Arizona and northwestern New Mexico.
- Lake Powell and Lake Mead are both currently at just 34% of capacity. In Arizona, the Salt is at 73% of capacity, the Verde System is only 53% full, and Alamo Dam sits at just 11% of capacity. In New Mexico, Elephant Butte Reservoir is currently at 13.5% of capacity.
- Fire potential is above normal for this time of year in New Mexico and Arizona, due to below-average snowpack and long-term drought conditions.
Warm and Dry Conditions Drove Drought Degradations Across Much of the Intermountain West Since October 1

Snow Deficits Persist in New Mexico, Arizona, and Southern Utah/Colorado
30-Day Precipitation Is Below Normal in Much of the Intermountain West
Outlooks and Potential Impacts in the Intermountain West
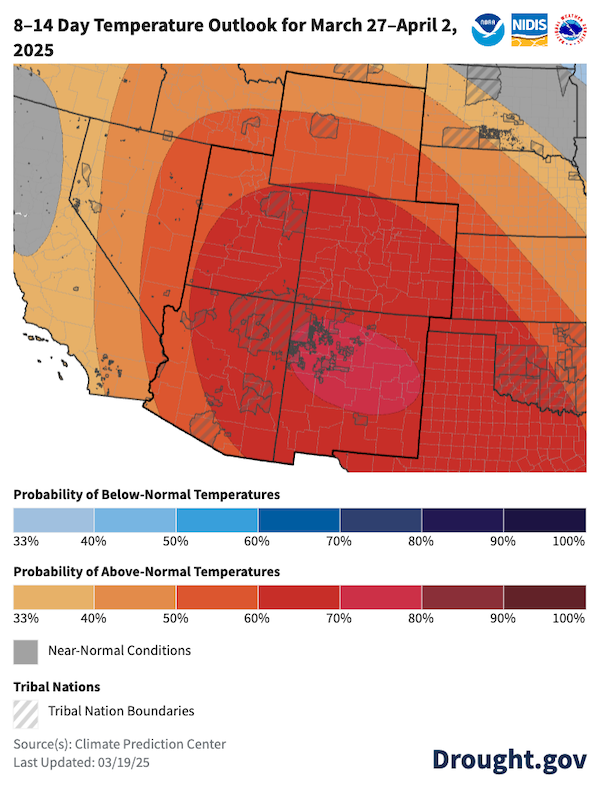
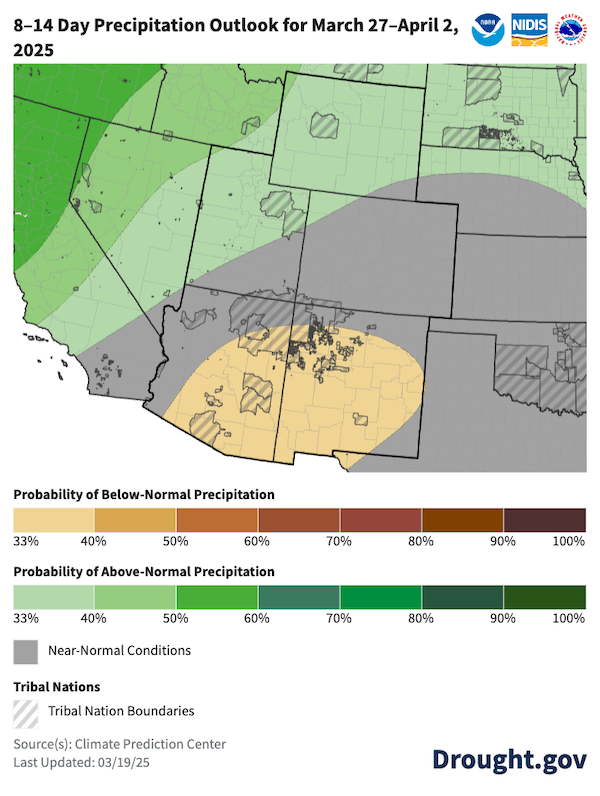
- In the next 8-14 days, well-above normal temperatures will likely drive early snowmelt and reduction in snow water equivalent (SWE) for the region, despite improvements from recent storms. Below-normal precipitation outlooks for much of Arizona and New Mexico could drive drought degradation for the Southwest.
- As of March 17, the U.S. Bureau of Reclamation reports below-average runoff for key reservoirs in the Intermountain West, with only 70% of unregulated flows forecast for Lake Powell in April–July, despite 92% of normal snow water equivalent (SWE) in the Upper Colorado Basin.
- A La Niña Advisory has been in place since December 2024, but La Niña has remained weak. Historically, La Niña correlates to drier winters for the southwestern U.S. El Niño Southern Oscillation (ENSO) neutral conditions are favored to develop in the next month and persist through the Northern Hemisphere summer months (62% chance in June-August 2025).
- Arizona and New Mexico face above-normal potential for significant wildfires through June, according to the National Interagency Fire Center.
- CPC’s Monthly and Seasonal Drought Outlooks favor drought persistence and development for most of the Intermountain West in March and over the next 3 months.
8-14 Day Outlooks Favor Warmer Temperatures the Intermountain West and Below-Normal Precipitation for Southern Parts of the Region
Resources
- More local information is available from the following resources:
- To report or view local drought impact information:
- Register for the next Intermountain West Drought and Climate Outlook Webinar on Tuesday, April 1 at 1 p.m. MT, which will provide updated information about conditions, impacts, and outlooks.
Prepared By
Dr. Gretel Follingstad
Cooperative Institute for Research in Environmental Sciences (CIRES)/University of Colorado Boulder
NOAA's National Integrated Drought Information System (NIDIS)
Dr. Dave Simeral
Western Regional Climate Center/Desert Research Institute
Dr. Erinanne Saffell
Arizona State Climate Office
Jon Meyer
Utah Climate Center
Tony Bergantino
Wyoming State Climate Office
Andrew Mangham
NOAA’s National Weather Service
Paul Miller
NOAA’s National Weather Service Colorado Basin River Forecast Center
This Drought Status Update is issued in partnership between the National Oceanic and Atmospheric Administration (NOAA) and state climate offices to communicate a potential area of concern for drought expansion and/or development within the Intermountain West region based on recent conditions and the upcoming forecast. NIDIS and its partners will issue future Drought Status Updates as conditions evolve.