After a Dry September and October, Drought Rapidly Expanded and Brush and Wildfire Activity Increased; Worsening Drought Is Likely
Key Points
- With a few days left in October, multiple New York and New England stations are on track for this month to rank among their driest Octobers on record.
- Abnormally Dry (D0) conditions and Moderate Drought (D1) expanded throughout most of New England and eastern New York. With an anticipated lack of significant rainfall for many locations, further degradation of drought conditions is likely.
- This dryness and drought, along with an abundance of fall leaf litter, stoked wildfire and brushfire activity.
- For the next few weeks, expansion of Abnormal Dryness (D0) and drought conditions are expected. Scattered rainfall coverage with totals of less than an inch and a half in northern portions of the region and less than half an inch in the driest portions of the region are not likely to erase deficits.
- Extended outlooks favor warm conditions that support drought expansion and intensification.
- Just to our south in Delaware, New Jersey, and Pennsylvania, Severe Drought (D2) is driving voluntary water restrictions, fire risk advisories, and required water conservation practices. Exceptional Drought (D4) persists in West Virginia.
See the Northeast Regional Climate Center blog for additional information.
The U.S. Drought Monitor depicts the location and intensity of drought across the country. The map uses 5 classifications: Abnormally Dry (D0), showing areas that may be going into or are coming out of drought, and four levels of drought (D1–D4).
The U.S. Drought Monitor is a joint effort of the National Oceanic and Atmospheric Administration, U.S. Department of Agriculture, and National Drought Mitigation Center.
A drought index combines multiple drought indicators (e.g., precipitation, temperature, soil moisture) to depict drought conditions. For some products, like the U.S. Drought Monitor, authors combine their analysis of drought indicators with input from local observers. Other drought indices, like the Standardized Precipitation Index (SPI), use an objective calculation to describe the severity, location, timing, and/or duration of drought.
Learn MorePeriods of drought can lead to inadequate water supply, threatening the health, safety, and welfare of communities. Streamflow, groundwater, reservoir, and snowpack data are key to monitoring and forecasting water supply.
Learn MoreDrought can reduce the water availability and water quality necessary for productive farms, ranches, and grazing lands, resulting in significant negative direct and indirect economic impacts to the agricultural sector. Monitoring agricultural drought typically focuses on examining levels of precipitation, evaporative demand, soil moisture, and surface/groundwater quantity and quality.
Learn MoreU.S. Drought Monitor Categories
D0 - Abnormally Dry
Abnormally Dry (D0) indicates a region that is going into or coming out of drought. View typical impacts by state.
D1 - Moderate Drought
Moderate Drought (D1) is the first of four drought categories (D1–D4), according to the U.S. Drought Monitor. View typical impacts by state.
D2 - Severe Drought
Severe Drought (D2) is the second of four drought categories (D1–D4), according to the U.S. Drought Monitor. View typical impacts by state.
D3 - Extreme Drought
Extreme Drought (D3) is the third of four drought categories (D1–D4), according to the U.S. Drought Monitor. View typical impacts by state.
D4 - Exceptional Drought
Exceptional Drought (D4) is the most intense drought category, according to the U.S. Drought Monitor. View typical impacts by state.
Total Area in Drought (D1–D4)
Percent area of the Northeast Drought Early Warning System that is currently in drought (D1–D4), according to the U.S. Drought Monitor.
The U.S. Drought Monitor depicts the location and intensity of drought across the country. The map uses 5 classifications: Abnormally Dry (D0), showing areas that may be going into or are coming out of drought, and four levels of drought (D1–D4).
The U.S. Drought Monitor is a joint effort of the National Oceanic and Atmospheric Administration, U.S. Department of Agriculture, and National Drought Mitigation Center.
This U.S. Drought Monitor is released every Thursday morning, with data valid through Tuesday at 7 a.m. ET.
A drought index combines multiple drought indicators (e.g., precipitation, temperature, soil moisture) to depict drought conditions. For some products, like the U.S. Drought Monitor, authors combine their analysis of drought indicators with input from local observers. Other drought indices, like the Standardized Precipitation Index (SPI), use an objective calculation to describe the severity, location, timing, and/or duration of drought.
Learn MorePeriods of drought can lead to inadequate water supply, threatening the health, safety, and welfare of communities. Streamflow, groundwater, reservoir, and snowpack data are key to monitoring and forecasting water supply.
Learn MoreDrought can reduce the water availability and water quality necessary for productive farms, ranches, and grazing lands, resulting in significant negative direct and indirect economic impacts to the agricultural sector. Monitoring agricultural drought typically focuses on examining levels of precipitation, evaporative demand, soil moisture, and surface/groundwater quantity and quality.
Learn MoreThis update is based on data available as of Wednesday, October 30, 2024 at 10 a.m. ET. We acknowledge that conditions are evolving.
Current Conditions in the Northeast
- Much of the Northeast has seen a dry fall. This month is on track to be one of the driest Octobers on record for many sites in New York and New England.
- Central Park, in New York City, last saw measurable rainfall on September 29.
- New York City reservoirs are currently at 66.8% of capacity. Normally they are closer to 75% of capacity this time of the year.
- Low streamflows, especially in northeastern Massachusetts, also reflect the lack of rain.
- Across the region, groundwater conditions are mixed. For example, most groundwater levels in Connecticut are normal, but in neighboring Massachusetts, more locations are reporting below-normal levels. Ample early summer rainfall over Connecticut is holding off groundwater deficits for now.
- Due in part to Abnormally Dry (D0) conditions and Moderate Drought (D1), much of the region faces a higher risk of bushfires and wildfires.
- Keetch-Byram Drought Index (KBDI) values are high across most of southeastern New York and southern New England, indicating low soil moisture and fire risk for these areas. On Monday, October 28, KBDI values were in the 400s and 500s for parts of this region. KBDI values in this range are typical of late summer and early fall, but when combined with little or no precipitation for an extended period, leaf litter and duff burn actively and can contribute to fire intensity.
Figure 1. Keetch-Byram Drought Index (KBDI) for the Northeast
Key takeaway: With low expectations for widespread and substantial rainfall, the fire risk will continue for some locations. KBDI values range from 300 to almost 600 in southern New York, Long Island, and much of southern New England. This represents an estimated 3 to 6 inches of net rainfall needed to bring the soil to saturation.
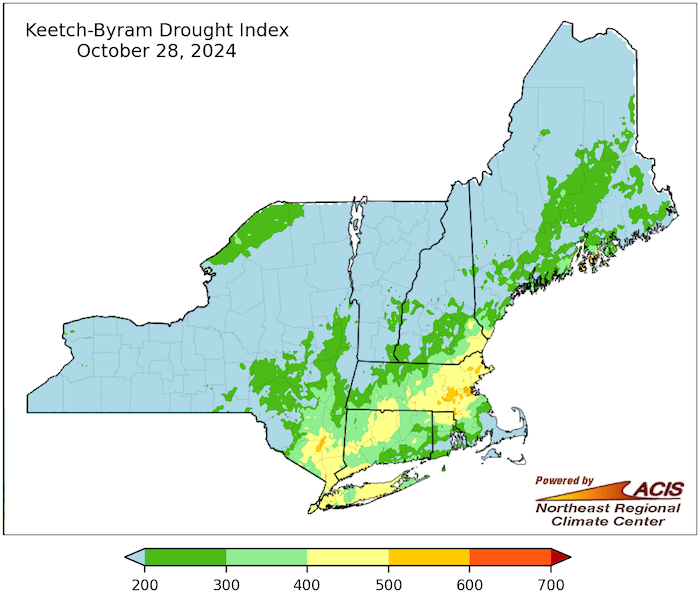
Figure 2. Accumulated Precipitation Departure from Normal for Select Locations Across the Northeast
Key takeaway: From Maine to New York City, accumulated precipitation departures from normal for selected cities demonstrate dry fall conditions across the Northeast.
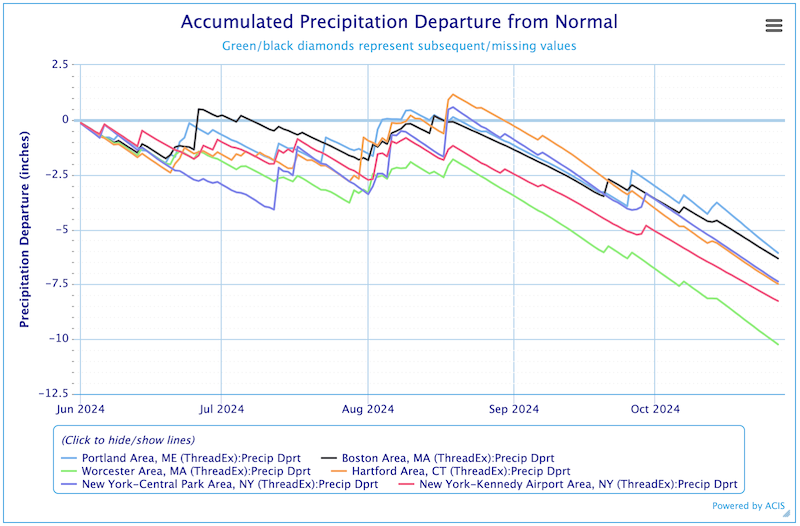
Figure 3. 7-Day Average Streamflow for the Northeast U.S.
Key takeaway: 7-day average streamflows are below- to much-below normal across much of southern New England, with some streamgages experiencing record lows.
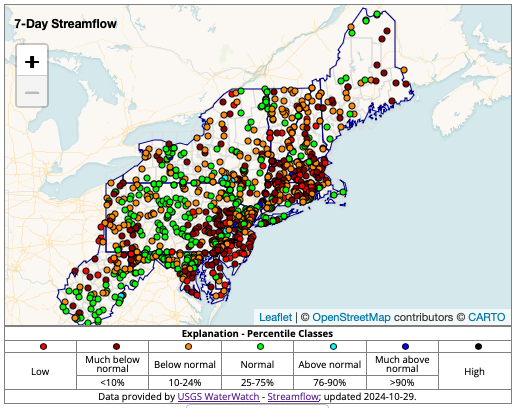
Figure 4. Streamflow Conditions on the Parker River at Byfield, Massachusetts
Key takeaway: This hydrograph on the Parker River at Byfield, Massachusetts (north of Boston), details the flow levels over the summer and early fall. The hydrograph shows the steady decline in streamflow over the last six months and generally below-normal conditions since mid-June. This is mainly the result of low precipitation in this region of northeastern Massachusetts, which was about 50%–75% of normal over those six months, and less than 25% of normal over the last two months.
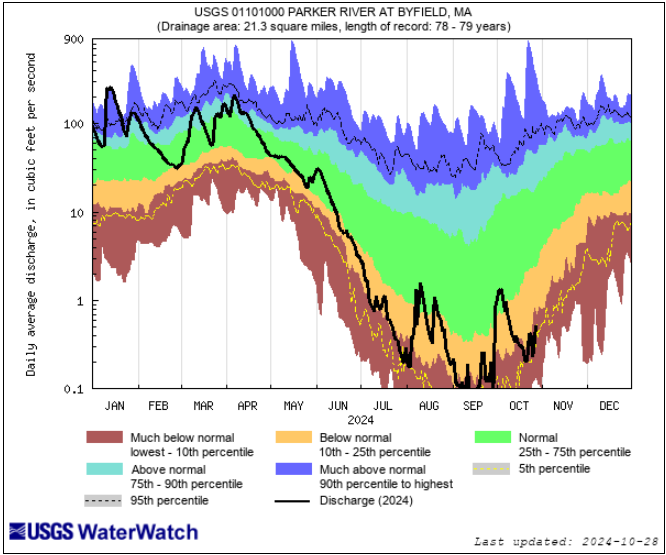
Figure 5. Photo of Low Streamflow on the Parker River at Byfield, Massachusetts
Key takeaway: This photo of the Parker River, taken on September 18, is an example of low streamflows in the region. The measured streamflow of 0.06 cubic feet per second is much below normal for this location.
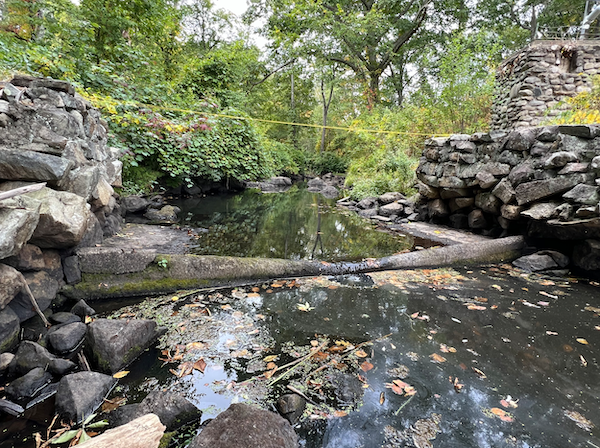
Figure 6. Groundwater Conditions for the Northeast U.S.
Key takeaway: Below-normal or lower groundwater percentiles are dominant in Massachusetts and scattered through portions of Maine and New York.
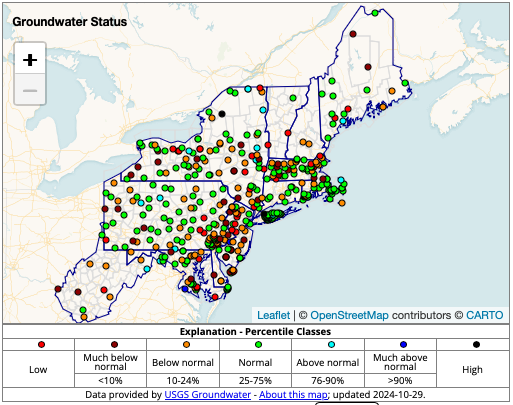
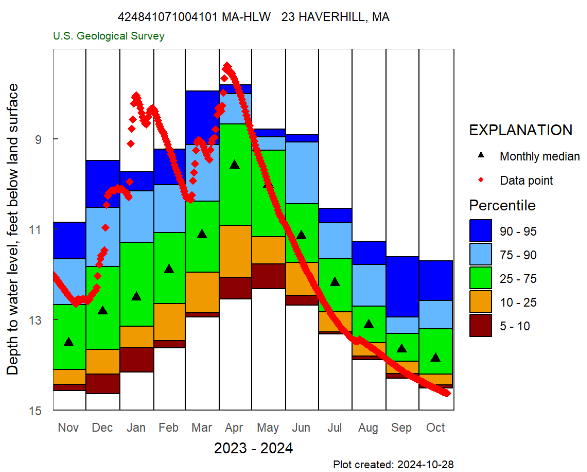
Figure 7. Groundwater Conditions in Haverhill, Massachusetts
Key takeaway: During the latter half of September and October, groundwater levels at the U.S. Geological Survey observation well MA-HLW 23 in Haverhill, Massachusetts were in the lowest 5% of recorded values. For example, on October 28, 2024, the groundwater level was 14.63 feet below land surface. The lowest recorded value in all Octobers for the 65-year period of record was 14.66 feet below land surface in 2016. The lowest recorded groundwater level for the entire period of record is 15.00 feet below land surface in 1966.
State Drought Impacts
- Connecticut:
- October 28, 2024: State Gets Federal Assistance for Brushfire
- October 26, 2024: Office of the Governor - Extreme Fire Danger in Connecticut
- October 25, 2024: NBC Connecticut - Multiple Brush Fires
- October 25, 2024: Office of the Governor - FEMA Fire Fighting Grant Secured
- October 24, 2024: Stamford Advocate - Fall Weather Laid the Foundation for Connecticut’s Wildfires
- October 17, 2024: The Hour - Brushfire Risk Increases with Rainfall Deficits
- Maine:
- October 28, 2024: Maine Forest Service - Wildfire Danger Report (updated daily)
- October 23, 2024: WGME - Portland’s Fall Proves Warmer and Drier than Usual
- Massachusetts:
- October 29, 2024: WCVB - Salem Public Schools Cancel Outdoor Activities Due to Smoke
- October 27, 2024: WCVB - Brush Fires Break Out in Salem and Beverly Amid Ongoing Drought
- October 28, 2024: The Gardner News: Wildfires Broke Out in Massachusetts Over the Weekend
- October 24, 2024: WWLP 22 News - A Look at How Dry Massachusetts Has Been
- October 22, 2024: City of Worcester - Outdoor Water Use Restrictions Enacted
- New Hampshire:
- October 27, 2024: NHPR - Dry Conditions and Wildfire Concerns
- New York:
- October 25, 2024: ABC News10 - Fire Danger in the Adirondacks
- October 26, 2024: Daily News - Crews Battle Brush Fires Across the Northeast Amid Extremely Dry Conditions
- October 24, 2024: WRRV - Fire Risk in the Hudson Valley
- October 18, 2024: Gothamist - Drought and Wildfires in New York and New Jersey
Report your local drought impacts by submitting a Condition Monitoring Observer Report:
Outlooks and Potential Impacts for the Northeast
- Portions of the region will likely see some rain in the next week. The National Weather Service’s Quantitative Precipitation Forecast suggests up to 1 inch is possible for some locations in northern New England (and up to 1.5 inches in northern New York) in the next 7 days. In southern New England, less than half an inch is expected and is not likely to eliminate drought.
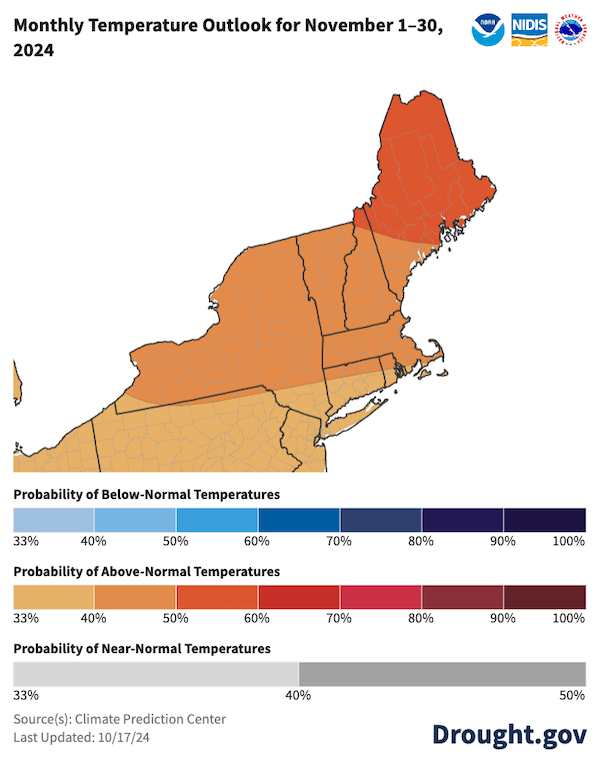
- According to NOAA’s National Weather Service Climate Prediction Center, odds favor warmer-than-normal temperatures in the next 6–10 days (November 4–8) and throughout November. This supports the likelihood that drought will expand and intensify through this period.
- Though rain in the next week will reduce fire risk in some locations, it will not eliminate the risk for all areas.
Figure 8. 7-Day Precipitation Forecast for the Northeast
Key takeaway: Rainfall will likely miss the areas where it is most needed or not be substantial enough to hold drought expansion and intensification at bay.
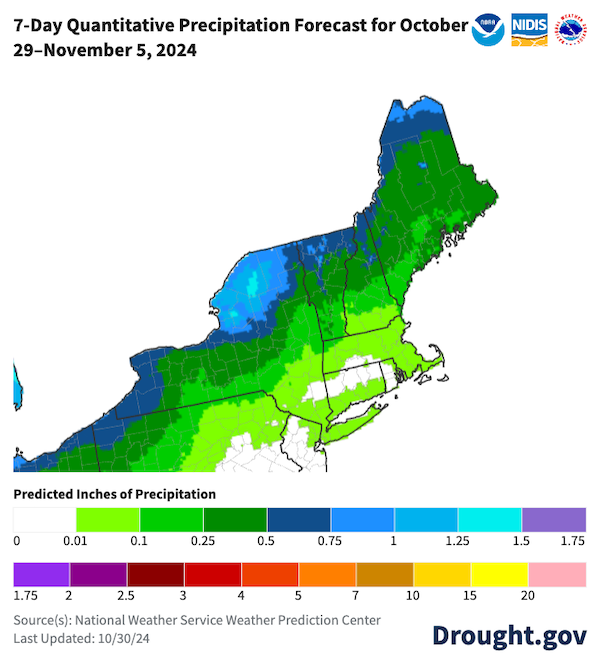
Figure 9. 6–10 Day Temperature Outlook for November 4–8
Key takeaway: Odds favor-warmer than-normal temperatures across the region from November 4–8. This will enhance the likelihood of drought expansion and intensification.
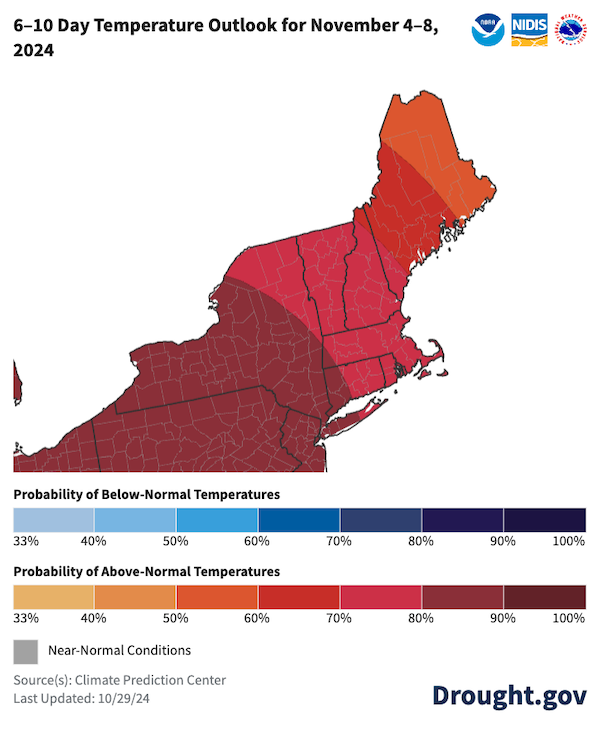
Figure 10. Monthly Temperature Outlook for November 2024
Key takeaway: Odds favor above-normal temperatures in November, which supports a likely expansion of Abnormal Dryness (D0) and intensifying drought in the region.
Additional Resources
- The next NOAA Eastern Region Climate Services webinar is Thursday, October 31 at 9:30 a.m. ET. There will be a review of October conditions and a look at New York State’s Extreme Heat Action Plan. Register here.
- El Niño-Southern Oscillation (ENSO) Outlook for November from the Northeast Regional Climate Center: Learn more about La Niña and how it manifests in the Northeast U.S.
- New York State Fire Danger Rating Area (FDRA) Risk map for Tuesday, October 29, 2024: The Department of Environmental Conservation divides the state into specific regions and assigns fire risk levels (from Low to Extreme) to communicate fire potential and describe control actions.
Prepared By
Sylvia Reeves
NOAA/National Integrated Drought Information System (NIDIS), CU Boulder/Cooperative Institute for Research in Environmental Sciences (CIRES)
Samantha Borisoff, Jessica Spaccio, Keith Eggleston, Natalie Umphlett, and Art DeGaetano
Northeast Regional Climate Center
Ellen Mecray
Regional Climate Services Director, Eastern Region, NOAA
Gardner Bent
USGS New England Water Science Center
In partnership with National Weather Service Offices of the Northeast and State Climate Offices of the Northeast.
This drought status update is issued in partnership between the National Oceanic and Atmospheric Administration (NOAA), Northeast Regional Climate Center, U.S. Geological Survey, and the U.S. Department of Agriculture (USDA) to communicate concern for drought expansion and intensification within the Northeast U.S. based on recent conditions and the forecasts and outlooks. NIDIS and its partners will issue future drought status updates as conditions evolve.


