For the latest forecasts and critical weather information, visit weather.gov.
Drought Expands and Intensifies with Exceptional Fire Activity and Low Reservoir Levels
Key Points
- Almost all (93%) of the Northeast Drought Early Warning System (DEWS) is experiencing Abnormal Dryness (D0) or drought, according to the latest U.S. Drought Monitor.
- Severe Drought (D2) conditions expanded in Massachusetts and into southeastern New York and portions of Connecticut.
- Moderate Drought (D1) coverage remained about the same as last week. In northern portions of the region, Abnormally Dry (D0) conditions persist in many areas, extending from western New York into northern Maine.
- Multiple sites had precipitation deficits of 5 to 9 inches since September 1. These precipitation deficits continue to build as New York and New England received only occasional rounds of light and widely scattered rainfall.
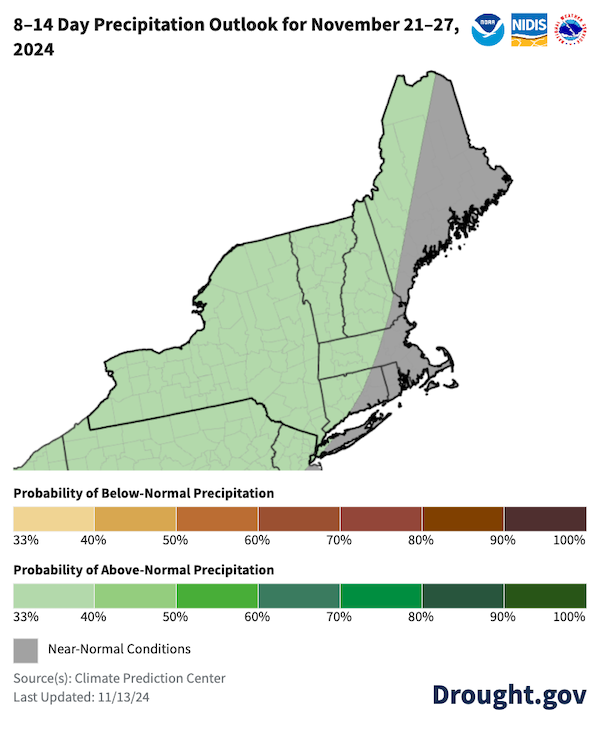
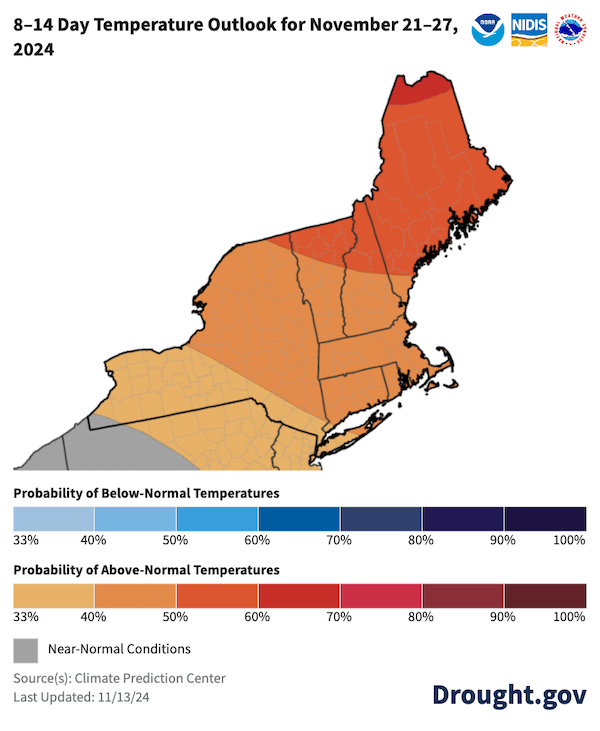
- The National Weather Service Climate Prediction Center’s 8-14-day outlooks are not encouraging for potential drought relief. Many areas in drought in eastern New England are likely to have near-normal precipitation, with only slightly increased chances of above-normal precipitation elsewhere. Precipitation in the next few weeks is not likely to be sufficient for drought elimination. Warmer-than-normal temperatures are predicted.
- With the continued persistence of dry conditions, wildfires and brush fires remain a threat throughout much of the region.
Learn more about precipitation deficits from the Northeast Regional Climate Center.
This update is based on data available as of Thursday, November 14, 2024 at 10 a.m. ET. We acknowledge that conditions are evolving.
The U.S. Drought Monitor depicts the location and intensity of drought across the country. The map uses 5 classifications: Abnormally Dry (D0), showing areas that may be going into or are coming out of drought, and four levels of drought (D1–D4).
The U.S. Drought Monitor is a joint effort of the National Oceanic and Atmospheric Administration, U.S. Department of Agriculture, and National Drought Mitigation Center.
A drought index combines multiple drought indicators (e.g., precipitation, temperature, soil moisture) to depict drought conditions. For some products, like the U.S. Drought Monitor, authors combine their analysis of drought indicators with input from local observers. Other drought indices, like the Standardized Precipitation Index (SPI), use an objective calculation to describe the severity, location, timing, and/or duration of drought.
Learn MorePeriods of drought can lead to inadequate water supply, threatening the health, safety, and welfare of communities. Streamflow, groundwater, reservoir, and snowpack data are key to monitoring and forecasting water supply.
Learn MoreDrought can reduce the water availability and water quality necessary for productive farms, ranches, and grazing lands, resulting in significant negative direct and indirect economic impacts to the agricultural sector. Monitoring agricultural drought typically focuses on examining levels of precipitation, evaporative demand, soil moisture, and surface/groundwater quantity and quality.
Learn MoreU.S. Drought Monitor Categories
D0 - Abnormally Dry
Abnormally Dry (D0) indicates a region that is going into or coming out of drought. View typical impacts by state.
D1 - Moderate Drought
Moderate Drought (D1) is the first of four drought categories (D1–D4), according to the U.S. Drought Monitor. View typical impacts by state.
D2 - Severe Drought
Severe Drought (D2) is the second of four drought categories (D1–D4), according to the U.S. Drought Monitor. View typical impacts by state.
D3 - Extreme Drought
Extreme Drought (D3) is the third of four drought categories (D1–D4), according to the U.S. Drought Monitor. View typical impacts by state.
D4 - Exceptional Drought
Exceptional Drought (D4) is the most intense drought category, according to the U.S. Drought Monitor. View typical impacts by state.
Total Area in Drought (D1–D4)
Percent area of the Northeast Drought Early Warning System that is currently in drought (D1–D4), according to the U.S. Drought Monitor.
The U.S. Drought Monitor depicts the location and intensity of drought across the country. The map uses 5 classifications: Abnormally Dry (D0), showing areas that may be going into or are coming out of drought, and four levels of drought (D1–D4).
The U.S. Drought Monitor is a joint effort of the National Oceanic and Atmospheric Administration, U.S. Department of Agriculture, and National Drought Mitigation Center.
This U.S. Drought Monitor is released every Thursday morning, with data valid through Tuesday at 7 a.m. ET.
A drought index combines multiple drought indicators (e.g., precipitation, temperature, soil moisture) to depict drought conditions. For some products, like the U.S. Drought Monitor, authors combine their analysis of drought indicators with input from local observers. Other drought indices, like the Standardized Precipitation Index (SPI), use an objective calculation to describe the severity, location, timing, and/or duration of drought.
Learn MorePeriods of drought can lead to inadequate water supply, threatening the health, safety, and welfare of communities. Streamflow, groundwater, reservoir, and snowpack data are key to monitoring and forecasting water supply.
Learn MoreDrought can reduce the water availability and water quality necessary for productive farms, ranches, and grazing lands, resulting in significant negative direct and indirect economic impacts to the agricultural sector. Monitoring agricultural drought typically focuses on examining levels of precipitation, evaporative demand, soil moisture, and surface/groundwater quantity and quality.
Learn MoreThis update is based on data available as of Thursday, November 14, 2024 at 8 a.m. ET. We acknowledge that conditions are evolving.
Current Conditions in the Northeast
- According to the November 12 U.S. Drought Monitor, 93% of the Northeast is Abnormally Dry (D0) or in Moderate to Severe Drought (D1–D2). Just to our south, Extreme Drought (D3) is impacting New Jersey and western Pennsylvania while Exceptional Drought (D4) persists in West Virginia.
- Several states issued drought watches and advisories over the last two weeks.
- On November 2, the New York Department of Environmental Conservation (DEC) declared a drought watch for 15 New York counties. New York City declared a Drought Watch on November 2. Residents are asked to begin water conservation efforts.
- As of November 7, Massachusetts declared Significant Drought (Level 2) or Critical Drought (Level 3) across most of the state.
- And on November 9, Connecticut’s governor declared a stage 2 drought advisory for the state.
- Multiple sites across the Northeast have had precipitation deficits of 5 to 9 inches since September 1.
- An estimated 3 to 6 inches of net rainfall is needed to bring the soil to saturation and reduce fire risk, as specified by the Keetch-Byram Drought Index (KBDI). KBDI values range from 300 to almost 600 in southern New York, on Long Island, and for much of southern New England. Fire risk also increased on Long Island and eastern Massachusetts as higher KBDI values (500 to 600) expanded to now cover more of these areas.
- Through the 28-, 14- and 7- day time periods, much-below-normal streamflows expanded in coverage across the region. The highest concentration of much below-normal sites are in southeast New York and southern New England.
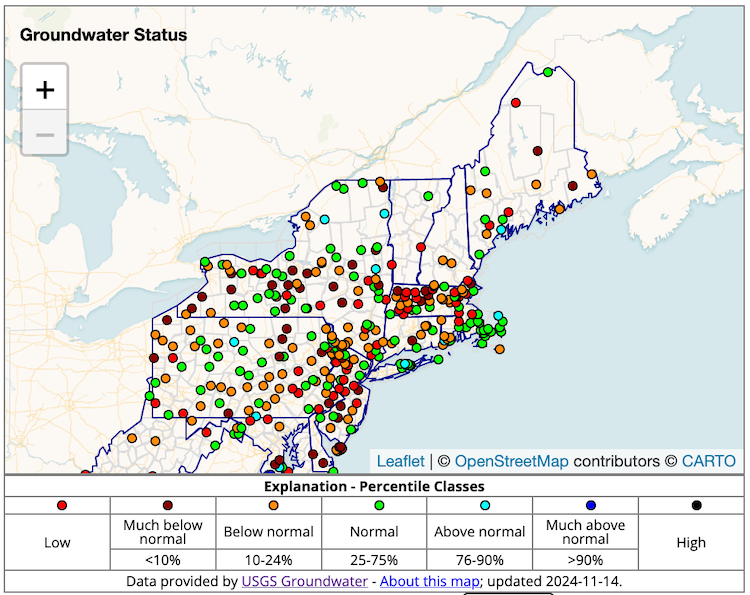
- Low groundwater percentiles are scattered across the region, but much-below-normal percentiles across Massachusetts strongly reflect the lack of rainfall.
- Numerous sites along the Northeast US coast are experiencing increasingly salty conditions in coastal wetlands and river systems. This indicates saltwater intrusion and low flow down tributaries and out to sea. Coastal communities should monitor for saltwater impacts on ecosystems and upstream communities should monitor saltwater fronts that may impact drinking water systems.
Figure 1. Keetch-Byram Drought Index (KBDI) for the Northeast
Key takeaway: KBDI values range from 300 to almost 600 in southern New York, on Long Island, and for much of southern New England, representing an estimated 3 to 6 inches of net rainfall needed to bring the soil to saturation.
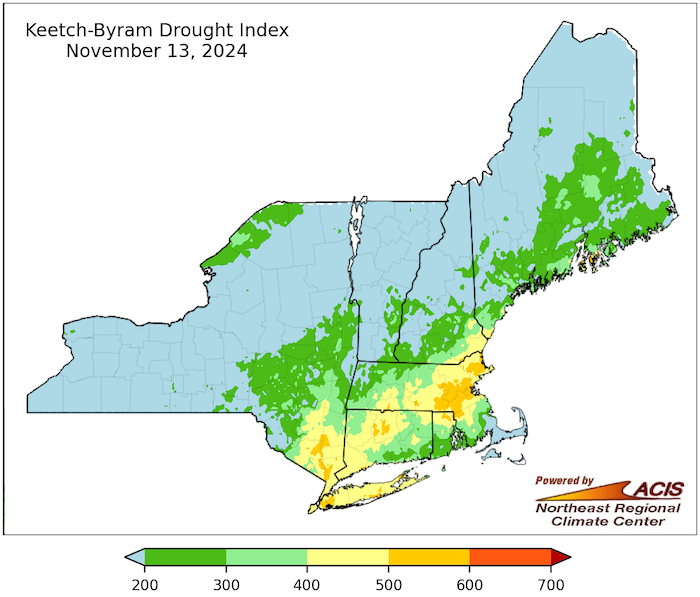
Figure 2. Coastal Salinity Index
Key takeaway: Daily updates of several sites in Maine and New Hampshire have coastal salinity conditions ranging from CD1 (Moderate Salinity Conditions) to CD3 (Extreme Salinity Conditions), according to the Coastal Salinity Index. Salinities at those locations are increasing relative to their normal levels, possibly impacting local ecosystems.
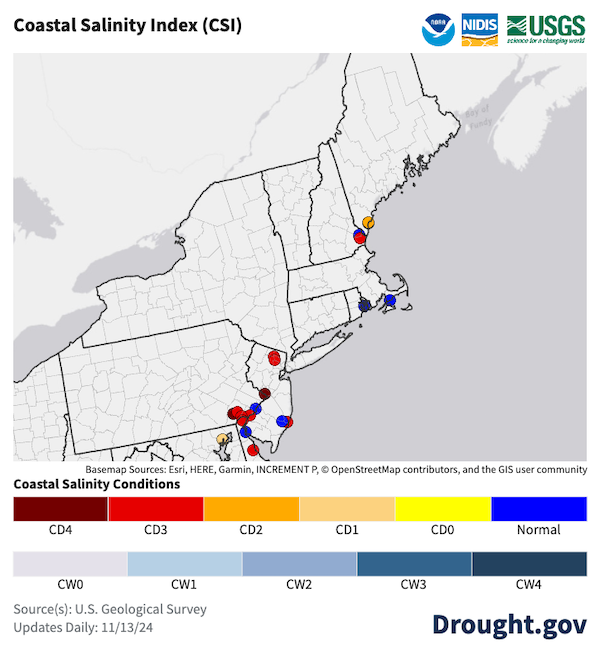
Figure 3. 7-Day Average Streamflow for the Northeast U.S.
Key takeaway: Below-normal and much-below-normal streamflows are prevalent across the region.
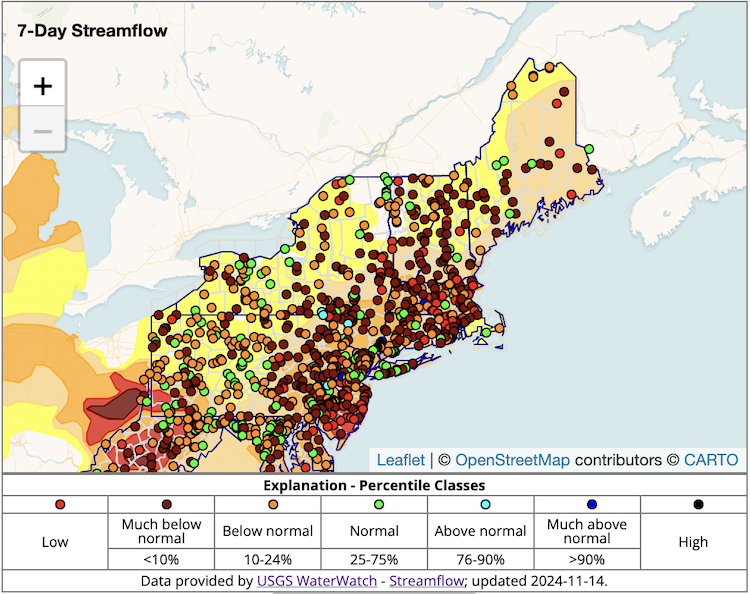
Figure 4. Groundwater Conditions for the Northeast U.S.
Key takeaway: Groundwater conditions lag behind the precipitation deficits of the last two months, but southeastern New York and Massachusetts subsurface water reserves are registering this impact. Sites in Connecticut, Maine, and upstate New York are also trending toward lower levels.
State and Regional Drought Impacts
- The lack of rainfall since the beginning of September has led to water supply impacts. Managers are closely monitoring drinking water status. Voluntary and mandatory water conservation measures are in place in some New England towns and cities. For example, certain municipalities in Massachusetts issued mandatory water use restrictions
- Regional reservoirs storing water for New York City continue to show lower capacities.
- Maine is collecting information about dry wells in the state.
- Over the past week, Condition Monitoring Observer Reports (CMOR) from Connecticut, southeastern New Hampshire, and New York note moderately dry conditions with low streamflows, changes to bird migration patterns, vegetation impacts, and concerns about dry wells.
Drought Impacts in the News
- Connecticut:
- November 7, 2024: NBC News - Drought Plagues Majority of Northeast
- October 30, 2024: WTNH.com NEWS8 - Hawthorne Fire Continues
- Maine:
- November 10, 2024: Maine Public - Maine Forest Service Reports High Fire Danger
- Massachusetts:
- November 12, 2024: WCVB - Attleboro Planning to Import Water from Rhode Island
- November 8, 2024: WBUR - The Drought in Massachusetts is Getting Worse
- November 2, 2024: MassLive - Northampton Wildfire Doubled Overnight
- November 1, 2024: Mass.gov - Wildfires Spiked by 1200% In October
- New Hampshire:
- November 7, 2024: WMUR - Groundwater Recharge Opportunities Become Limited With the Approach of Winter and Frozen Ground
- New York:
- November 12, 2024: New York State - Update on Wildfires in New York
- November 9, 2024: Forbes - Smoke Smell Hits NYC
- November 8, 2024: NBC News - Brush Fire Breaks out in Brooklyn’s Prospect Park
- November 6, 2024: CBS New York - Drought Conditions are Getting Worse in the Hudson Valley
- November 1, 2024: The Ithaca Voice - Brushfire Updates
- Vermont:
- November 11, 2024: WCAX - Wildfires Impact Air Quality
- November 11, 2024: Vermont Department of Forests, Parks, and Recreation - Vermont Extends Ban on Debris Burning for Four Southern Counties
Regional:
- Delaware River Basin Drought Management and Flow Snapshot includes information on New York City reservoir storage and the Delaware River Basin Salt Front status.
- New Jersey Drought Status and Conditions provides information on drinking water status and conditions. View reservoir levels.
Report your local drought impacts by submitting a Condition Monitoring Observer Report:
Outlooks and Potential Impacts for the Northeast
- The National Weather Service Climate Prediction Center’s (CPC’s) 8–14 day outlook shows increased chances of warmer-than-normal temperatures.
- According to CPC’s precipitation outlook for November 18–22, odds favor near-normal precipitation in eastern New England, with only slightly increased chances for above-normal precipitation in the rest of the Northeast.
- Without significant and widespread rain or snow that melts before the ground freezes, recharge of streams and groundwater will be blunted. Drought conditions and impacts are likely to continue.
Figure 5. 8–14 Day Precipitation and Temperature Outlooks for November 21–27
Key takeaway: Over the next 8-14 days, slightly increased chances for above-normal precipitation are expected. With warmer-than-normal temperatures also more likely, the odds do not favor drought relief before the ground is expected to freeze over. Once the ground freezes, the soil's ability to capture rain or melted snow is reduced.
Additional Resources
- The next NOAA Eastern Region Climate Services webinar is Thursday, November 21 at 9:30 a.m. ET. There will be a presentation on the "Use of NOAA Radar Data to Analyze Extreme Precipitation." Register here.
New York Department of Environmental Conservation Drought Conditions Map
Fire resources:
Prepared By
Sylvia Reeves
NOAA/National Integrated Drought Information System (NIDIS), CU Boulder/Cooperative Institute for Research in Environmental Sciences (CIRES)
Samantha Borisoff, Jessica Spaccio, Keith Eggleston, Natalie Umphlett, and Art DeGaetano
Northeast Regional Climate Center
Ellen Mecray
Regional Climate Services Director, Eastern Region, NOAA
Gardner Bent
USGS New England Water Science Center
In partnership with National Weather Service Offices of the Northeast and State Climate Offices of the Northeast.
This drought status update is issued in partnership between the National Oceanic and Atmospheric Administration (NOAA), Northeast Regional Climate Center, U.S. Geological Survey, and the U.S. Department of Agriculture (USDA) to communicate concern for drought expansion and intensification within the Northeast U.S. based on recent conditions and the forecasts and outlooks. NIDIS and its partners will issue future drought status updates as conditions evolve.


