Drought and Its Impacts Define Summer in the Pacific Northwest
Key Points
- According to the U.S. Drought Monitor, 47% of the Pacific Northwest Drought Early Warning System is experiencing drought conditions (D1-D4). Drought is most severe in central Washington, northern Idaho, and western Montana, where Severe Drought (D2) to Exceptional Drought (D4) persists.
- A long and historic early season heatwave degraded drought conditions and reduced moisture in vegetation that can fuel wildfires across the region. The extended extreme heat caused historic levels of evaporation across the Pacific Northwest landscape, which is now evident in extremely dry soils and fuels.
- Oregon had an early and aggressive start to the wildfire season. As of July 25, the state of Oregon preliminarily reported over 898,000 acres burned thus far during 2024, which is far above the recent 10-year average for late July. Four of these wildfires are over 100,000 acres each: the Falls, Cow Valley, Durkee, and Lone Rock fires. The Cow Valley Fire and Durkee Fire have now merged to form the largest wildfire in the U.S. as of July 25, 2024.
- Continued warmer-than-normal summer temperatures and below-normal precipitation in Washington, coupled with the lingering impacts of the winter snow drought, led to additional water supply issues across some parts of the state.
- Oregon declared its first drought emergency of the summer on June 25, 2024 in Jefferson County, its fifth straight in 5 years.
The U.S. Drought Monitor depicts the location and intensity of drought across the country. The map uses 5 classifications: Abnormally Dry (D0), showing areas that may be going into or are coming out of drought, and four levels of drought (D1–D4).
The U.S. Drought Monitor is a joint effort of the National Oceanic and Atmospheric Administration, U.S. Department of Agriculture, and National Drought Mitigation Center.
A drought index combines multiple drought indicators (e.g., precipitation, temperature, soil moisture) to depict drought conditions. For some products, like the U.S. Drought Monitor, authors combine their analysis of drought indicators with input from local observers. Other drought indices, like the Standardized Precipitation Index (SPI), use an objective calculation to describe the severity, location, timing, and/or duration of drought.
Learn MorePeriods of drought can lead to inadequate water supply, threatening the health, safety, and welfare of communities. Streamflow, groundwater, reservoir, and snowpack data are key to monitoring and forecasting water supply.
Learn MoreDrought can reduce the water availability and water quality necessary for productive farms, ranches, and grazing lands, resulting in significant negative direct and indirect economic impacts to the agricultural sector. Monitoring agricultural drought typically focuses on examining levels of precipitation, evaporative demand, soil moisture, and surface/groundwater quantity and quality.
Learn MoreU.S. Drought Monitor Categories
D0 - Abnormally Dry
Abnormally Dry (D0) indicates a region that is going into or coming out of drought. View typical impacts by state.
D1 - Moderate Drought
Moderate Drought (D1) is the first of four drought categories (D1–D4), according to the U.S. Drought Monitor. View typical impacts by state.
D2 - Severe Drought
Severe Drought (D2) is the second of four drought categories (D1–D4), according to the U.S. Drought Monitor. View typical impacts by state.
D3 - Extreme Drought
Extreme Drought (D3) is the third of four drought categories (D1–D4), according to the U.S. Drought Monitor. View typical impacts by state.
D4 - Exceptional Drought
Exceptional Drought (D4) is the most intense drought category, according to the U.S. Drought Monitor. View typical impacts by state.
Total Area in Drought (D1–D4)
Percent area of the Pacific Northwest that is currently in drought (D1–D4), according to the U.S. Drought Monitor.
The U.S. Drought Monitor depicts the location and intensity of drought across the country. The map uses 5 classifications: Abnormally Dry (D0), showing areas that may be going into or are coming out of drought, and four levels of drought (D1–D4).
The U.S. Drought Monitor is a joint effort of the National Oceanic and Atmospheric Administration, U.S. Department of Agriculture, and National Drought Mitigation Center.
This map is released every Thursday morning, with data valid through the previous Tuesday at 7 a.m. ET.
A drought index combines multiple drought indicators (e.g., precipitation, temperature, soil moisture) to depict drought conditions. For some products, like the U.S. Drought Monitor, authors combine their analysis of drought indicators with input from local observers. Other drought indices, like the Standardized Precipitation Index (SPI), use an objective calculation to describe the severity, location, timing, and/or duration of drought.
Learn MorePeriods of drought can lead to inadequate water supply, threatening the health, safety, and welfare of communities. Streamflow, groundwater, reservoir, and snowpack data are key to monitoring and forecasting water supply.
Learn MoreDrought can reduce the water availability and water quality necessary for productive farms, ranches, and grazing lands, resulting in significant negative direct and indirect economic impacts to the agricultural sector. Monitoring agricultural drought typically focuses on examining levels of precipitation, evaporative demand, soil moisture, and surface/groundwater quantity and quality.
Learn MoreCurrent Conditions for the Pacific Northwest
- High pressure over the region caused temperatures to far exceed normal, increasing evaporative demand. Coupled with below-normal summer precipitation, these conditions intensified drought and dryness across much of the region, including Idaho and Montana where Extreme and Exceptional drought developed and expanded (Figure 1, Figure 5).
- Over the last 30 days, precipitation was below normal (bottom 33% of historical conditions) across nearly all of the region, with parts of eastern Oregon reporting their driest conditions on record for this time period (Figure 2).
- Over the last 30 days, temperatures were much above normal (top 10% of historical conditions) across nearly all of the region. Large parts of Oregon, Idaho, and western Montana experienced record warm temperatures (Figure 3).
- Streamflows across Washington, Oregon, Idaho, and western Montana continue to be much below normal as a result of much-above-normal temperatures, much-below-normal precipitation, and below-normal winter snowpack (Figure 4).
Figure 1: 6-Week U.S. Drought Monitor Change Map (Since June 11, 2024)
Key Takeaway: Drought intensified across much of the Pacific Northwest, including much of Oregon, central Washington, and south-central Idaho, during June and July.
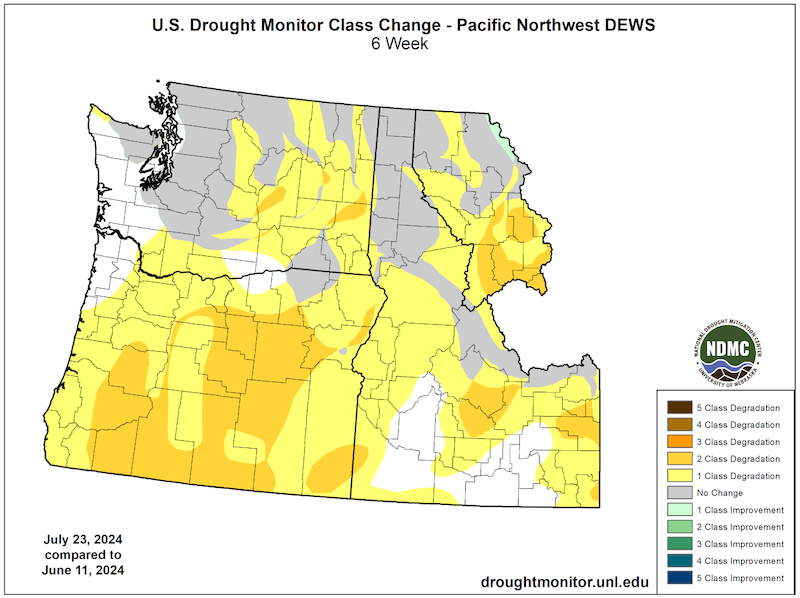
Figure 2: 30-Day Precipitation Percentiles (June 23–July 22, 2024)
Key Takeaway: Over the past 30 days, precipitation totals across large parts of the Pacific Northwest were below normal (in the bottom third of historical conditions). Precipitation percentiles were lowest in southeastern Washington, central Oregon, and central Idaho where some values were in the lowest 10% to record driest.
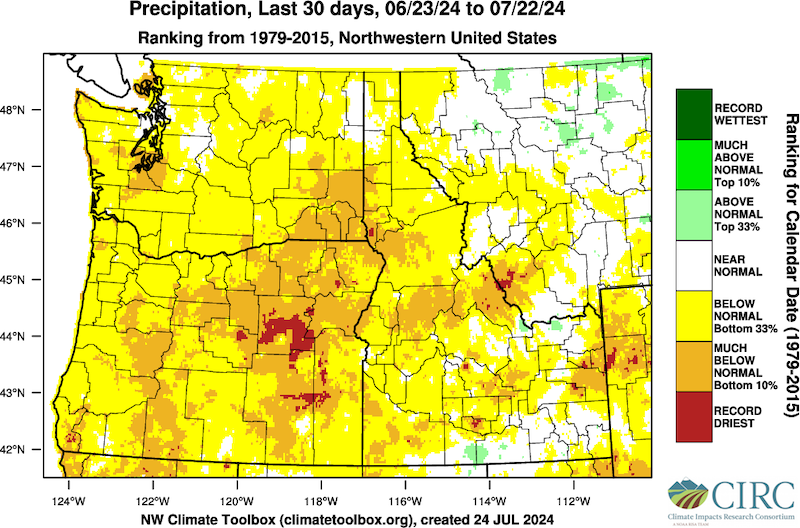
Figure 3: 30-Day Temperature Percentiles (June 23–July 22, 2024)
Key Takeaway: Over the past 30 days, temperatures across nearly all of the Pacific Northwest were above much normal (top 10%). Large parts of Oregon, Idaho, and northwestern Montana experienced record warmest temperatures.
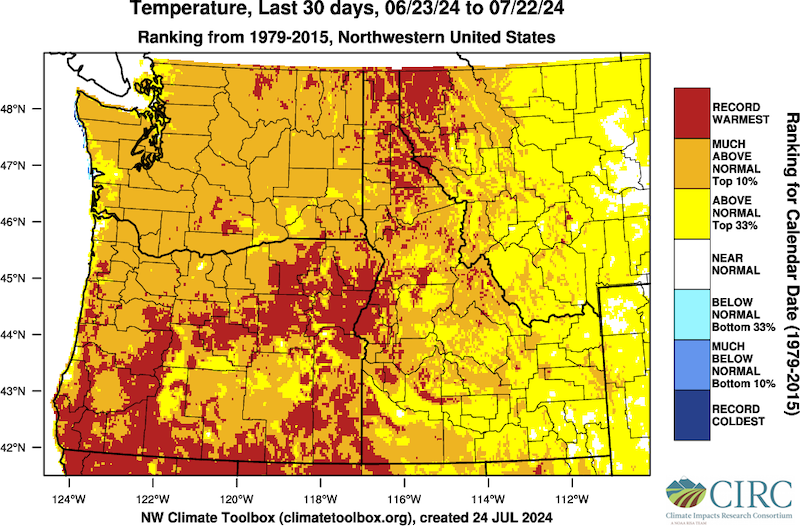
Figure 4: 28-Day Average Streamflow (July 24, 2024)
Key Takeaway: Across Washington, central and eastern Oregon, and northern Idaho, U.S. Geological Survey streamflows were below normal (below the 24th percentile) due to below-normal precipitation, above-average temperatures, and the effects of below-normal winter snowpack. In addition, stream gauges monitored by the Oregon Water Resources Department (OWRD) show much-below-normal streamflow conditions, most notably in northeast and central Oregon, according to the agency’s July 15, 2024 Bi-Weekly Drought Update.
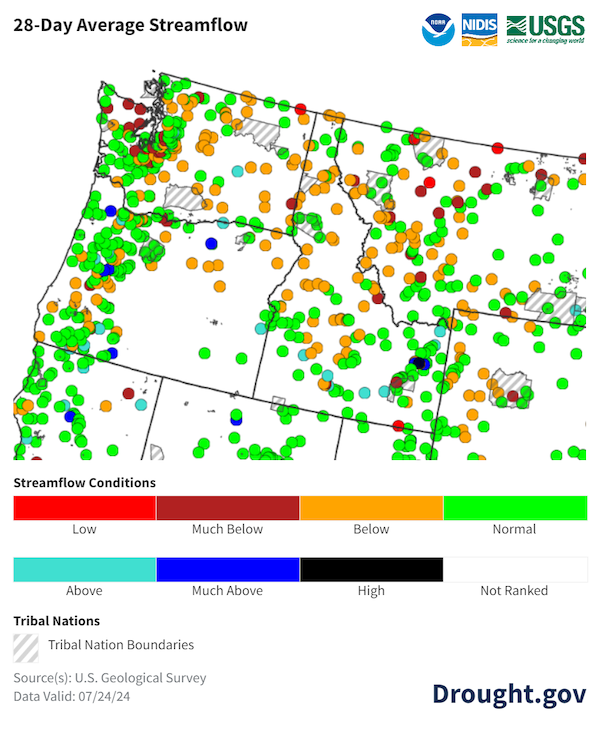
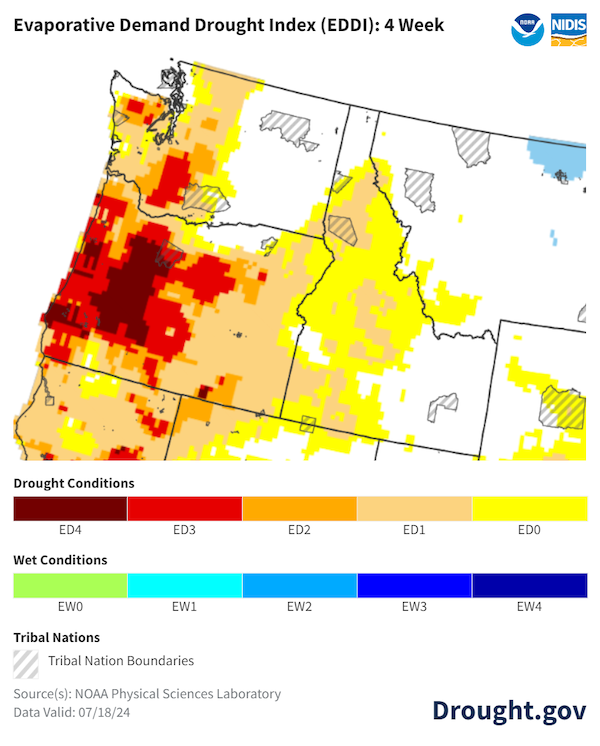
Figure 5: 4-Week Evaporative Demand Drought Index (EDDI) for July 24, 2024
Key Takeaway: Much-above-normal temperatures across the region caused significant evaporative demand, a measure of the water drawn from the land surface into the atmosphere through evaporation and transpiration from plants. The significant evaporative demand across the landscape resulted in extremely dry land surfaces and reduced soil moisture, particularly in Oregon.
Pacific Northwest Drought Impacts
- Due to the effects of multi-year drought, poor water supply conditions, and below-average precipitation, a drought disaster declaration was declared for Jefferson County, Oregon.
- Some pro-ratable irrigators across the Yakima Basin are receiving 50% of their full allotments as a result of prorationing of water in the basin. Irrigators in the basin are already experiencing major drought impacts with increased crop stress and the need to fallow some crops.
- An aggressive start to the Oregon wildfire season has resulted in several megafires burning across the state. As of July 24, 2024, more than 898,000 acres are preliminarily reported to have burned thus far, far above the recent 10-year average. Four of those wildfires are over 100,000 acres each: the Falls, Cow Valley, Durkee, and Lone Rock fires. The Cow Valley fire and Durkee fire have merged to form the largest wildfire in the U.S. as of July 25, 2024.
- The Yakima Reservoir in central Washington has reached its fifth lowest storage level since 1971. The U.S. Bureau of Reclamation expects very low reservoir storage by season’s end across the state, further compounding significant concerns for low streamflow impacts on aquatic species.
- Flows in western Montana have been at record lows across multiple basins, and as a result stream temperatures have risen to levels requiring river closures to protect trout in the state.
- Air quality has deteriorated across large parts of the region due to smoke from large active wildfires.
- April–September water supply forecasts are near record lows in many places (based on 75 years of historical data, 1949–2023).
- Olympic Basin: The Dungeness, Elwha, and Skokomish rivers are forecasted to be at the third, second, and second lowest flows on record, respectively.
- Skagit Basin: Multiple sites on the Skagit River are forecasted to have their 3rd lowest flows.
- Yakima Basin: The Yakima and Cle Elum rivers are forecasted to have their 8th and 4th driest flows, respectively.
- Columbia Basin: Multiple sites are forecasted to have their 4th lowest flows on record.
- Okanogan Basin: The Okanogan River is forecasted to have its 4th lowest flows on record.
Report your local drought impacts through a Condition Monitoring Observer Report:
Figure 6: 0–100 cm Soil Moisture Conditions (July 24, 2024)
Key Takeaway: The warm and dry summer across the region resulted in large areas with near-surface (0–100 cm) soil moisture much drier than normal, in the bottom 30th percentile. Soil moisture across much of southeastern Washington and in western Oregon is well below normal, in the 0–5th percentile relative to historical conditions (1981–2013). Soil moisture in northern Washington and central and eastern Oregon is above normal, in the 70th–100th percentile.
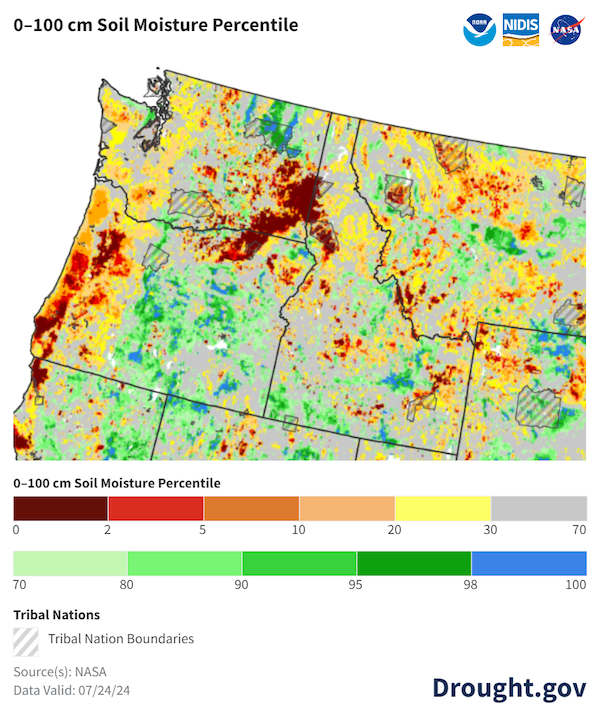
Figure 7: Major U.S. Bureau of Reclamation Storage Reservoirs in the Bear Creek and Little Butte Creek Basins
Key Takeaway: Much-above-normal temperatures and much-below-average precipitation across the Bear Creek and Little Butte Creek Basins in Oregon resulted in water levels below the capacity of some reservoirs. Water levels in four of five reservoirs were near or well below 50% of capacity.
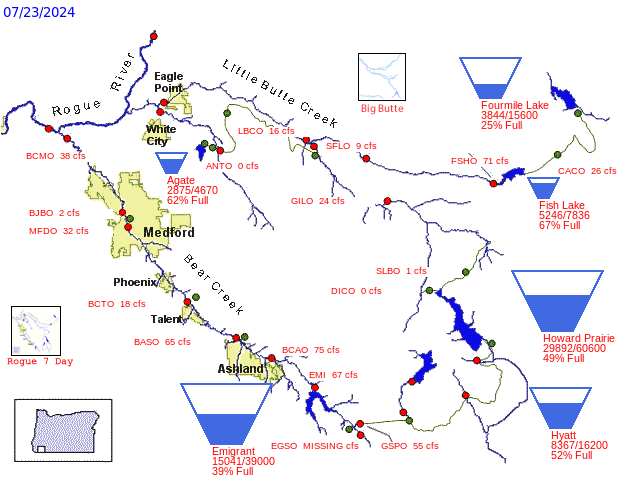
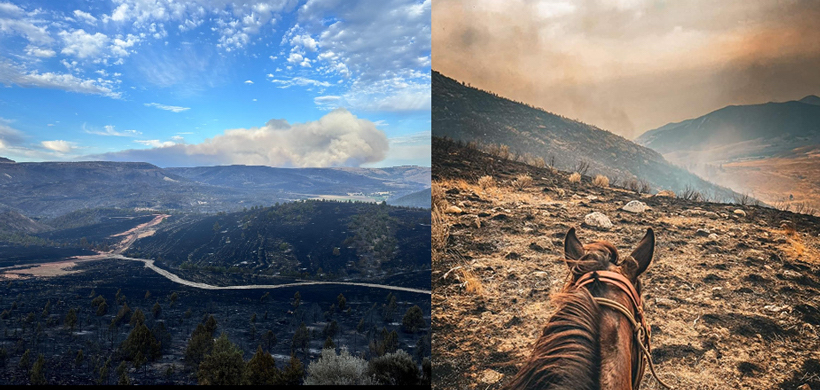
Figure 8: Fire Impacts in Oregon and Washington
Key Takeaway: Below-normal precipitation, above-average temperatures, and high evaporative demand contributed to drying vegetation that burned in the Cow Valley Fire, which merged with the larger Durkee Fire. The combined fire was reported at 268,492 acres without containment as of July 25, 2024.
Outlooks and Potential Impacts
Outlooks & Forecasts for Summer 2024
- The Climate Prediction Center’s outlooks for August indicate above-normal temperatures and below-normal precipitation are likely to continue across the region (Figure 9).
- The U.S. Seasonal Drought Outlook (Figure 10) predicts drought is likely to persist and become more severe across Washington, Idaho, and Oregon from July 18–October 31, 2024, except in western Washington and Oregon and southern Idaho. Given these long-term predictions, drought is expected to adversely affect water supply, human health, and agricultural production further throughout the summer.
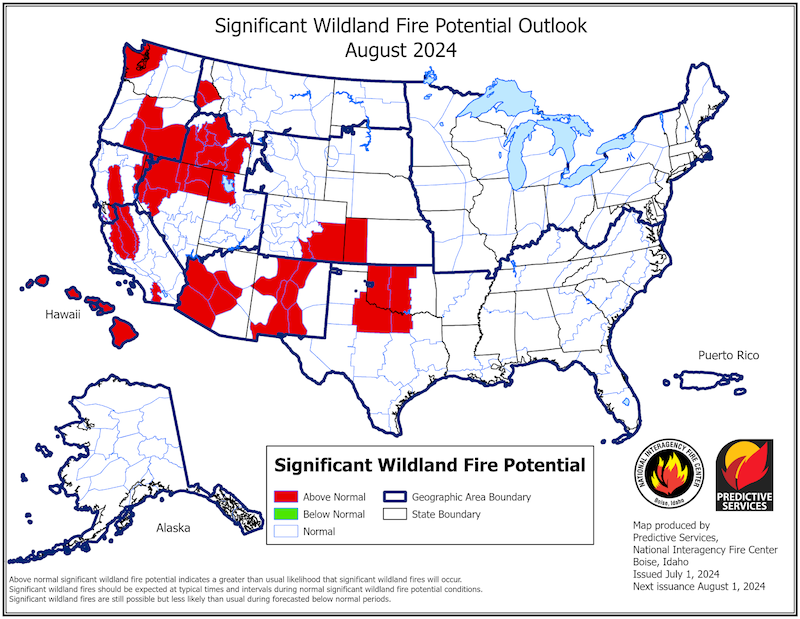
- The risk of wildfire is still a large concern this summer, as the National Fire Preparedness Level is currently at level 5. The National Significant Wildland Fire Potential Outlook, released on July 1, 2024, indicates that fire potential will remain above normal across most of Oregon, Idaho, and western Washington (Figure 11).
Figure 9: 1-Month Precipitation and Temperature Outlooks for August 2024
Key Takeaway: The Climate Prediction Center projects temperatures are likely to be above normal and precipitation below normal in much of the Pacific Northwest during August 2024.
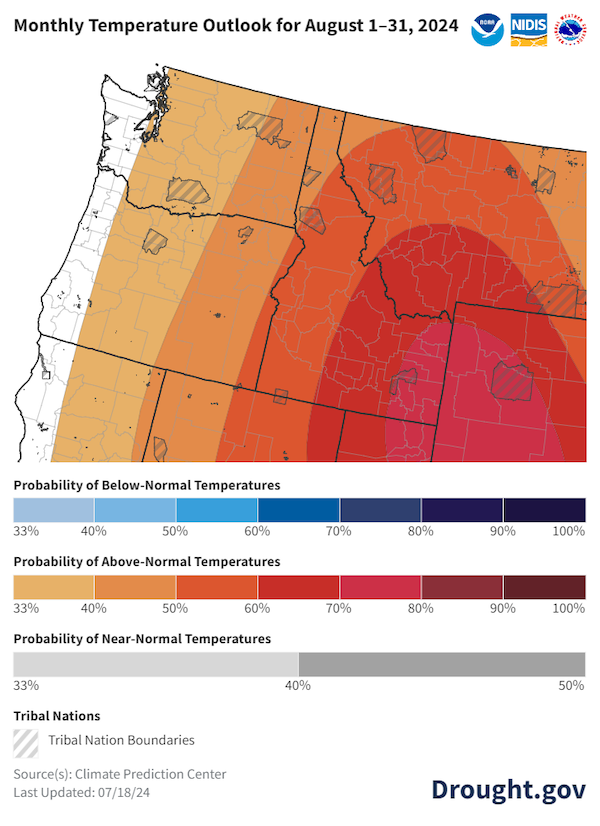
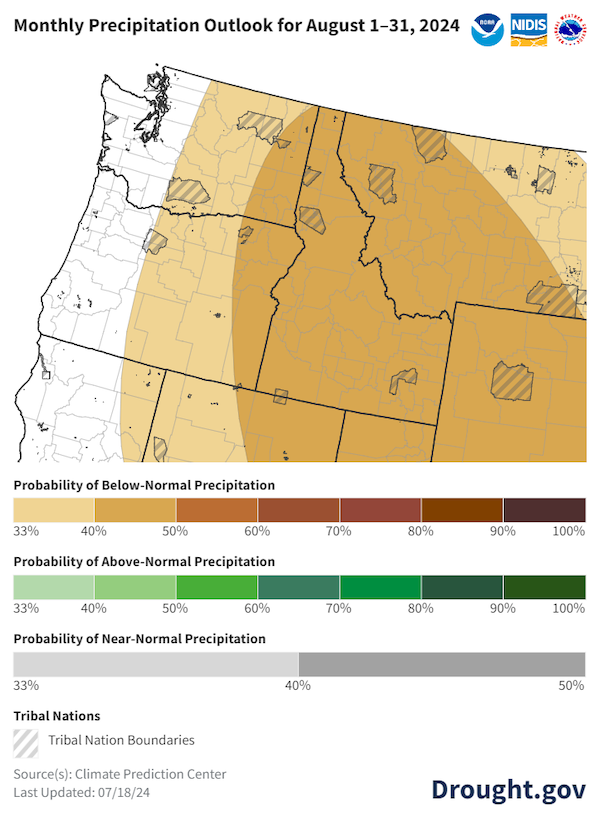
Figure 10: U.S. Seasonal (3-Month) Drought Outlook
Key Takeaway: The NOAA Climate Prediction Center’s U.S. Seasonal Drought Outlook (valid July 18–October 31, 2024) indicates drought will persist in regions east of the Cascade Range in Washington, the Idaho panhandle, and south-central Oregon. Drought expansion is likely across nearly all of the region, except western Washington and Oregon and parts of southern Idaho.
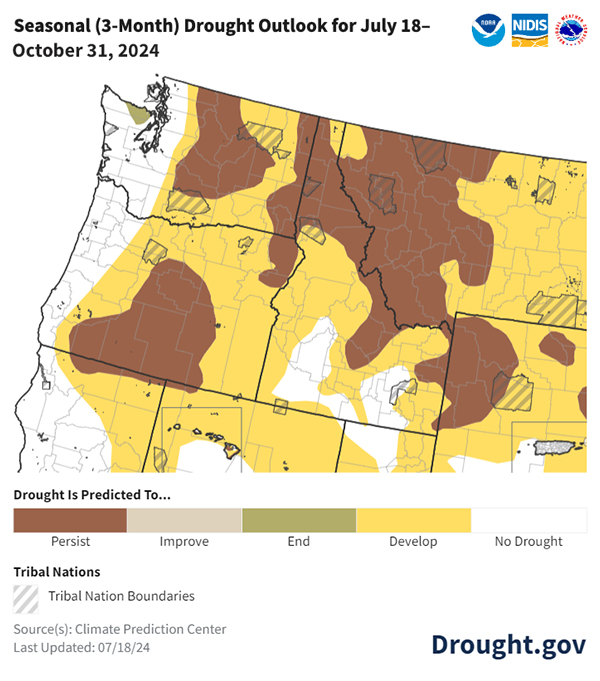
Figure 11: Significant Wildland Fire Potential Outlook for August 2024
Key Takeaway: Large portions of Idaho, Oregon, western Washington, and a small area in western Montana have significant (above-normal) wildland fire potential for August 2024.
Resources
- U.S. Department of Agriculture Disaster Assistance
- State of Washington Water Resources Drought Response Grants
- InciWeb: An interagency all fire risk incident information management system
- AirNow U.S. Fire and Smoke Map
- U.S. Drought Monitor tribal land maps and statistics (select "Tribal Areas" for Area type, then select a tribal reservation under Area)
- USDA Northwest Climate Hub
- Bureau of Indian Affairs Branch of Tribal Climate Resilience
- Register for the next Pacific Northwest Drought Early Warning System Webinar on Monday, August 26 at 11 a.m. PDT.
Prepared By
Jason Gerlich
Cooperative Institute for Research in Environmental Sciences (CIRES), NOAA's National Integrated Drought Information System
Karin Bumbaco
Office of the Washington State Climatologist, University of Washington
Caroline Mellor
Washington State Department of Ecology
Holly Prendeville
USDA Northwest Climate Hub
Erica Fleishman
Oregon Climate Change Research Institute, Oregon State University
Cameron Greenwood
Oregon Water Resources Department
Larry O’Neill
Oregon Climate Service, Oregon State University
This Drought Status Update is issued in partnership between the National Oceanic and Atmospheric Administration (NOAA) and Oregon Climate Change Research Institute, Washington State Department of Ecology, Oregon Water Resources Department, USDA Climate Hubs, Office of the Washington State Climatologist, and Oregon Climate Service to communicate a potential area of concern for drought expansion and/or development within the Pacific Northwest DEWS region based on recent conditions and the upcoming forecast. NIDIS and its partners will issue future Drought Status Updates as conditions evolve.
