Logo

Related Data & Maps
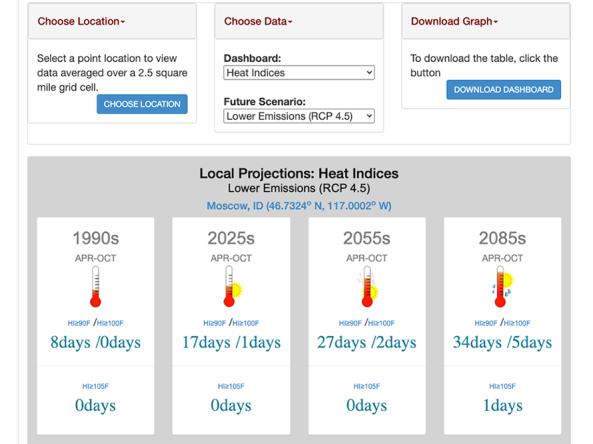
This tool, available as part of The Climate Toolbox, provides a table of future climate projections from an average of 20 global climate models under either high or low future greenhouse gas emissi
Period of Record
Forecasts
File Format
images
csv
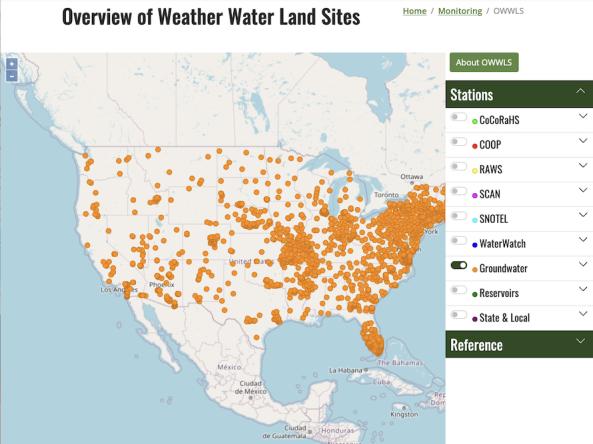
OWWLS, Overview of Weather Water Land Sites, maps the location of weather stations, streamgages, groundwater monitoring stations and reservoirs across the United States, Puerto Rico, and the
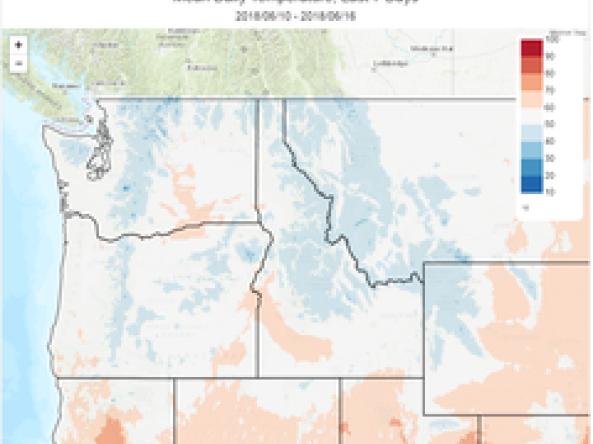
The Climate Toolbox is a collection of web tools for visualizing past and projected climate and projected climate and hydrology of the contiguous United States of America.
Period of Record
Current Conditions, Historical data (period of record varies)
File Format
images
csv
netcdf-4
netcdf-3
Related Events
Related Webinar Recaps
Related Drought Status Updates
January 24, 2023
July 25, 2024
March 16, 2023
March 6, 2025
April 6, 2023
April 3, 2025
Related News
Site Section
News & Events
Key Points:Climate change is causing the probability of extreme events, like drought, to change, a phenomenon known statistically as “non-stationarity.” Challenges include identifying the differences between permanent change (e.g., long-term trends towards wetter or drier conditions) and temporary anomalies from normal conditions (e.g., drought).Changes in how we assess drought could impact
Related Documents
Document Date
March 2023
Document Date
February 2022
Document Date
February 2021
Document Date
October 2020


