Another hot and dry summer ahead.
Key Points
- Extreme (D3) to Exceptional (D4) drought continues across the Intermountain West.
- Drought conditions improve over eastern Colorado and central Wyoming, but remain or worsen for the rest of the region.
- June (1 month) and summer (3-month) outlooks show that above-normal temperatures for all of the the Intermountain West are most likely.
- Below-normal summer precipitation is expected for Utah, Wyoming, Colorado, and New Mexico.
Current U.S. Drought Monitor map for the Intermountain West Drought Early Warning System region with data valid for May 25, 2021. The U.S. Drought Monitor is updated each Thursday to show the location and intensity of drought across the country.
Extreme (D3) to Exceptional (D4) drought persists across much of the Intermountain West:
- Arizona (87% of the state)
- Colorado (29%)
- New Mexico (75%)
- Utah (90%)
- Wyoming (2%)
U.S. Drought Monitor Categories
Current U.S. Drought Monitor map for the Intermountain West Drought Early Warning System region with data valid for May 25, 2021. The U.S. Drought Monitor is updated each Thursday to show the location and intensity of drought across the country.
Extreme (D3) to Exceptional (D4) drought persists across much of the Intermountain West:
- Arizona (87% of the state)
- Colorado (29%)
- New Mexico (75%)
- Utah (90%)
- Wyoming (2%)
Recent and Current Conditions
U.S. Drought Monitor Conditions
- Over half (57%) of the combined Intermountain West region is in Extreme (D3) to Exceptional (D4) drought.
- Extreme (D3) drought conditions have been in place in this region since May 2020.
- The extent of D4 drought in the Intermountain West reached a peak of 45% area in December 2020, a new record for the region.
- Moderate (D1) or worse drought has been in the region since August 2009.
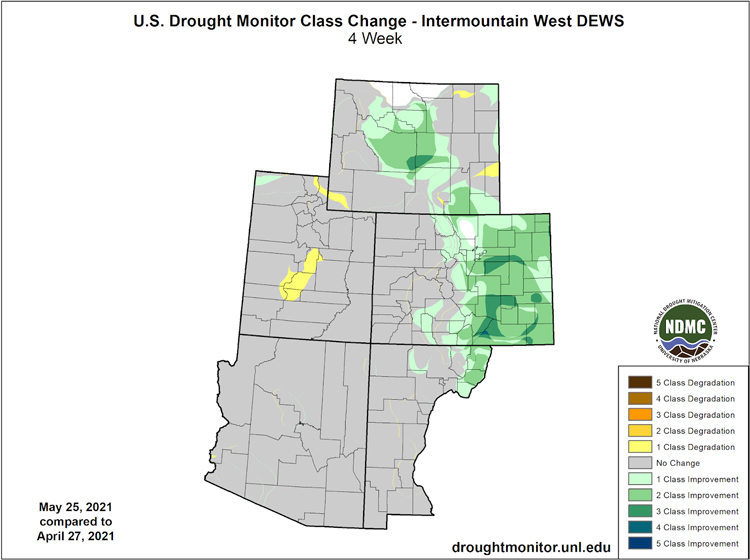
U.S. Drought Monitor 1-Month Change Map
- Colorado and central Wyoming have seen a 1- to 3-category drought improvement over 1 month due to rainfall in early May.
- Drought conditions have remained or deteriorated across the rest of the region.
State Drought Plans, Declarations, or States of Emergency in Effect
| Arizona | Colorado | New Mexico | Utah |
|---|---|---|---|
| Drought declaration from 2007 that has not been rescinded | State Drought Mitigation and Response Plan shifted from Phase 2 to Phase 3 (full activation) on November 30, 2020 | Drought declaration and activation of the State Drought Task Force, December 9, 2020 | Drought state of emergency issued on March 17, 2021 |
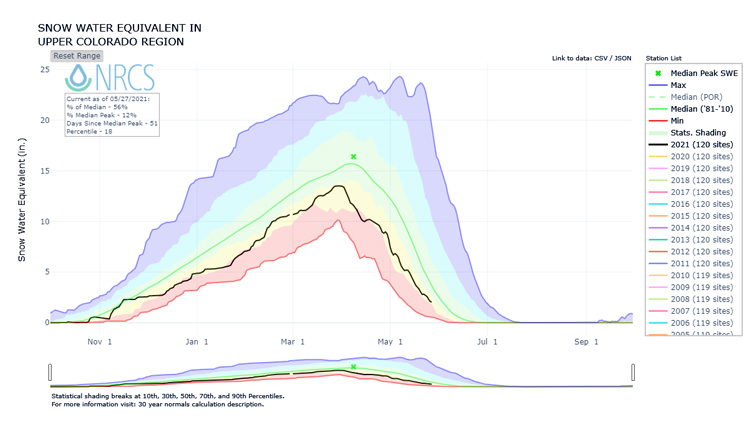
Current Snow Water Equivalent (SWE)
- Combined poor peak snowpack and/or rapid spring melt rates lead to western drought expansion and degradation.
- At its peak, seasonal snowpack was near average east of the Continental Divide, but below average west of the Divide.
- The Upper Colorado River basin snow water equivalent is currently at 58% of the 1981–2010 median for this point in the snow season.
Snow Water Equivalent in the Upper Colorado Region
May Precipitation
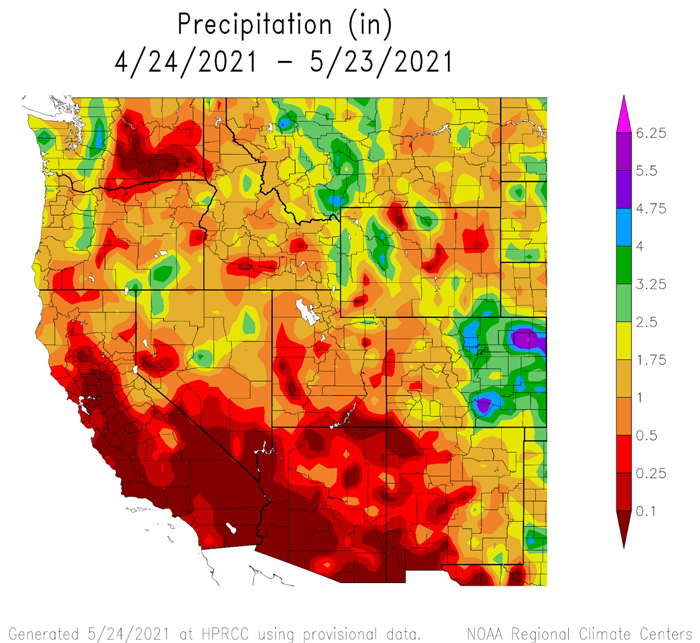
Most of the precipitation in the region over the past month has been in eastern Colorado where between 2 and 5 inches has accumulated since April 24.
Precipitation Conditions: April 24–May 23, 2021
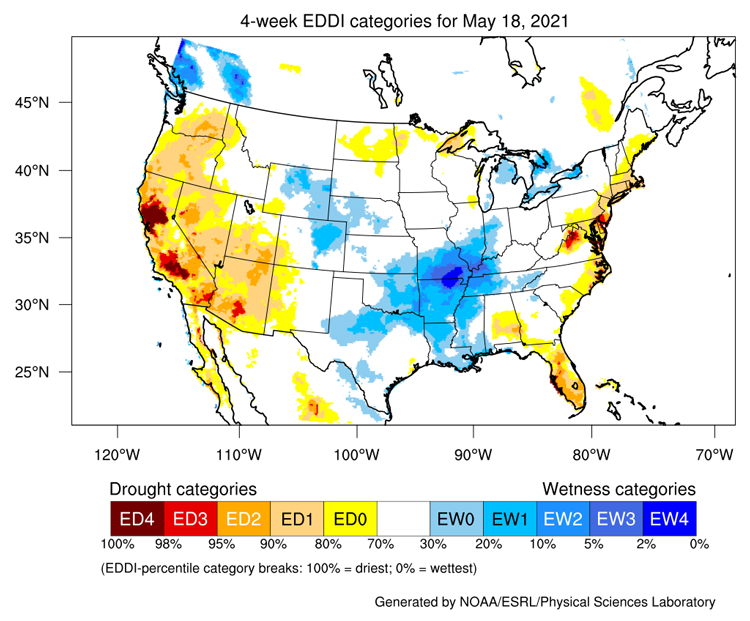
Evaporative Drought Demand Index (EDDI)
4-Week EDDI for May 18, 2021
- EDDI values have been favorable for Colorado and Wyoming over the past month.
- There is high evaporation demand for this time of year across southern Utah and Arizona.
Forecasts and Seasonal Outlooks
8–14 Day Outlooks
- May and June are usually the driest months of the year for the southwest
- Below-normal precipitation is favored in the 8–14 day outlook for Utah.
- Above-normal temperatures are most likely for Arizona and Utah while odds slightly favor below-normal temperatures for eastern New Mexico.
8–14 Day Temperature Outlook
8–14 Day Precipitation Outlook
1-Month Outlooks for June
- June precipitation is usually low across the Intermountain west. This year, below-normal precipitation and above normal temperatures are expected for Colorado and northern Utah with drought conditions expected to worsen.
- The Southwest monsoon season officially begins on June 15, but monsoon rainfall is more likely to occur in July and August.
- Temperatures are expected to be high.
- There is an equal chance of above- or below-normal precipitation for Arizona, southern Utah, and western New Mexico.
June 2021 Temperature Outlook
June 2021 Precipitation Outlook
June-August Seasonal Outlook
- For June to August, there is a greater chance for above-normal temperatures across the Southwest.
- Below normal precipitation is favored for the Intermountain West region through the summer. Arizona has an equal chance of above or below normal precipitation.
3-Month Temperature Outlook
3-Month Precipitation Outlook
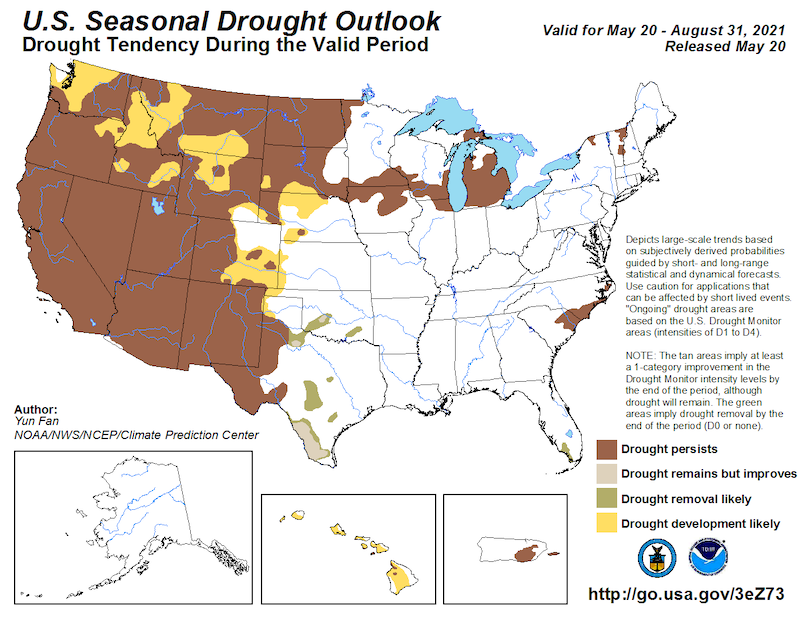
Drought Outlook
Long-term drought conditions are forecast to continue at least through August across the Intermountain West.
3-Month Drought Outlook
Climate Patterns
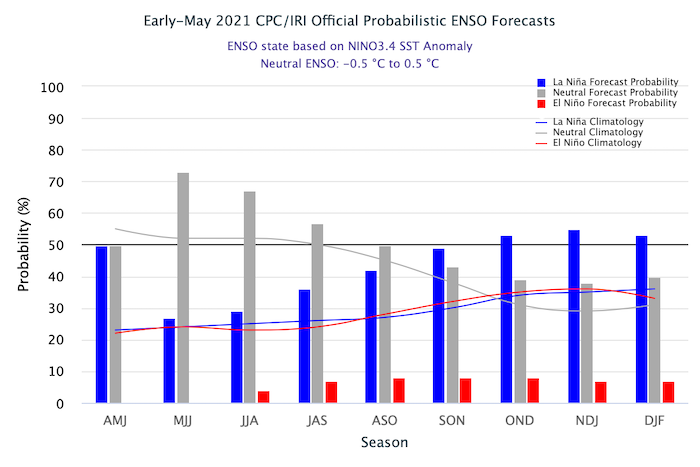
- NOAA’s El Niño–Southern Oscillation (ENSO) alert system status is currently at ENSO neutral.
- For more information please check out the NOAA ENSO blog and the Western Regional Climate Center info page about the La Nina impacts for the west.
- ENSO forecasts from the International Research Institute (IRI) for Climate and Society show ENSO neutral conditions continuing through summer. A resurgence of La Niña conditions in autumn is possible.
Probability of El Niño, La Niña, or Neutral Conditions
State-Based Conditions and Impacts
Arizona
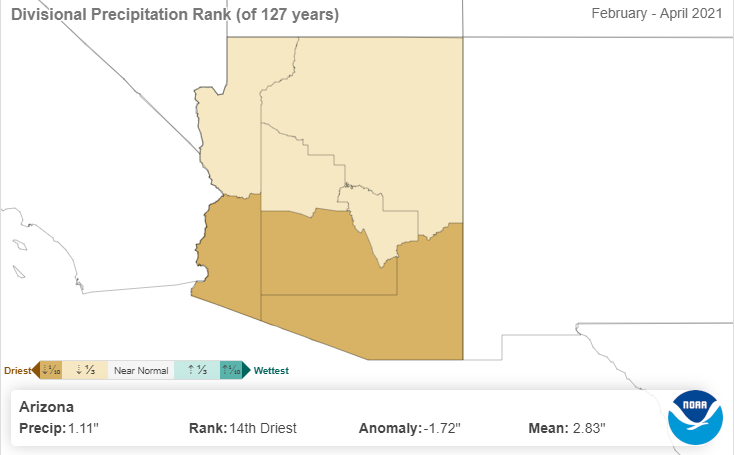
- 100% of state is in some measure of drought, with 87% in Extreme (D3) or Exceptional (D4) drought. 12-month rainfall totals for most of southeast Arizona are at or near the record lowest levels.
- 90% of the state pasture land is rated as poor to very poor compared to just 13% at this time last May, and the 5-year average of 35%.
- Fire:
- Stage 2 fire restrictions were issued in southeastern Arizona. Arizona has had 350 wildland fires already this year, with two Type 1 fires (highest level incident and fire suppression response).
- There is above-normal fire risk for all of Arizona during the remainder of May and June.
- Water storage:
- Lake Mead has dropped to 1,074.96 feet, which is designated to trigger a Tier 1 shortage.
Arizona February to April Precipitation Rankings
Colorado
- April 2021 was the driest April on record for the west slopes of Colorado, increasing concerns about summer water availability and fires.
- Water use curtailments are in place, such as for the McPhee Reservoir in Southwest Colorado.
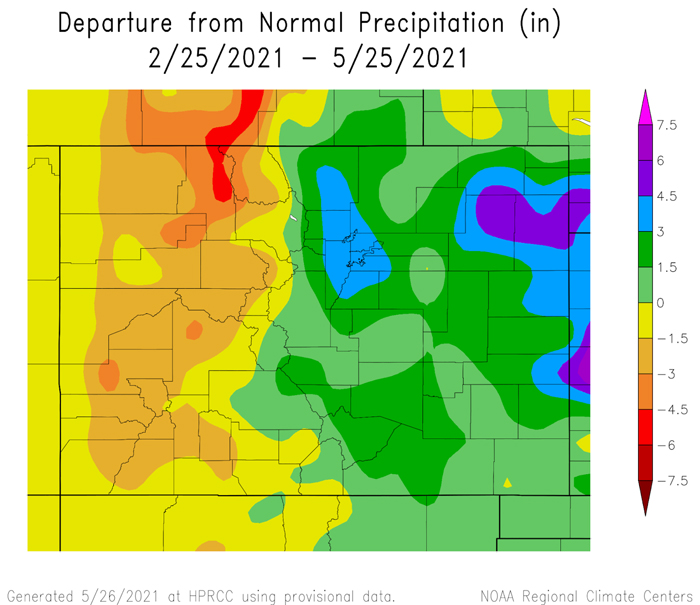
- Above-average spring precipitation has been well-timed and beneficial east of the Continental Divide.
- Municipal water providers in Denver and Colorado Springs reported no planned restrictions at the May Water Availability Task Force meeting.
- May is a climatologically wet month for eastern Colorado and very important for agriculture. May 2021 has been wetter than normal.
- The Grass-Cast product now shows that average precipitation for the remainder of the season would lead to above-average production.
- Colorado State University Extension reports that wet soils have kept tractors out of the fields and led to delayed planting for some farmers.
- Late planting in the spring leaves corn more vulnerable to early freezes in the fall.
3-Month Precipitation Anomalies for Colorado
New Mexico
- Much of the state continues to struggle with long-term drought from the lack of summer precipitation in both 2019 and 2020. The 12-month period from April 2021 to May 2020 was the driest on record state-wide.
- State-wide, 62% of the state's pastures and rangelands were reported in very poor to poor condition, compared with 38% last year, and a 5-year average of 36%.
- From the May 23 USDA Crop Progress Report, 82% of the state had very short to short top soil moisture compared to the 5-year average of 66%.
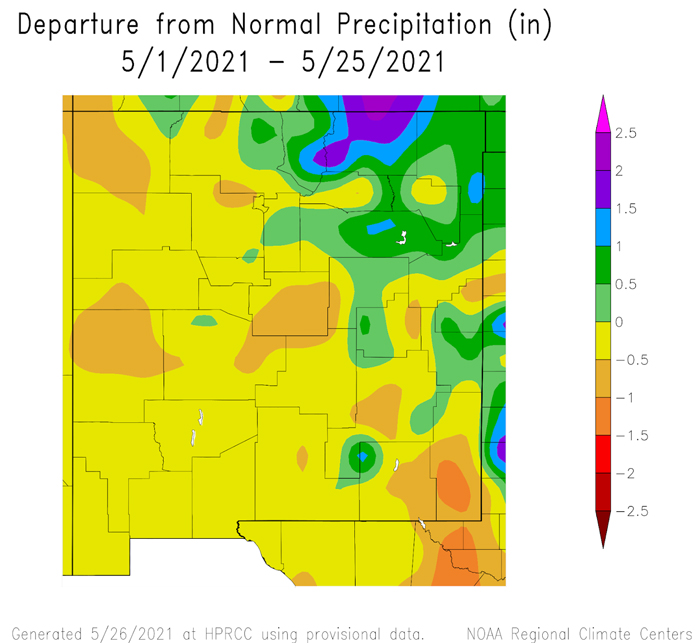
- Precipitation for May-to-date has been below average for most of the state, but above average across the northeast corner of New Mexico.
- Precipitation is historically low in May.
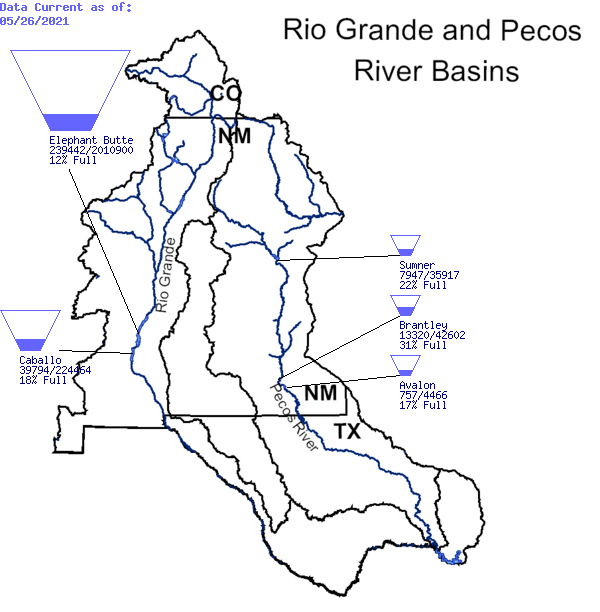
- Long-term drought shows up clearly in surface water levels in the Rio Grande and Pecos Basins. For example, Elephant Butte storage is 12% of capacity.
May 2021 Precipitation Anomalies for New Mexico
Rio Grande and Pecos River Basin Reservoir Storage
Utah
- The recent rain events of biweekly intervals have eased the drought status slightly.
- Northern Utah has benefitted the most from these rains, with the rest of the state seeing less than 0.5 inches of rain in the last 30 days.
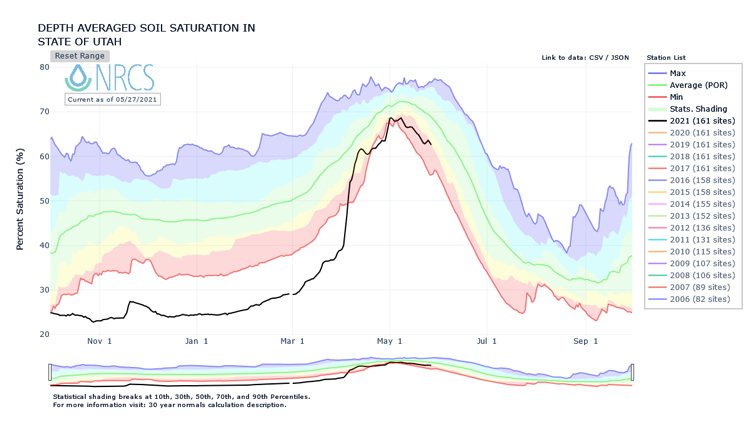
- The light rains have not translated to much improvement in soil moisture, but the evaporative demand over the last month has not been significant. This has helped what little rain has fallen to remain in the soils as much as possible.
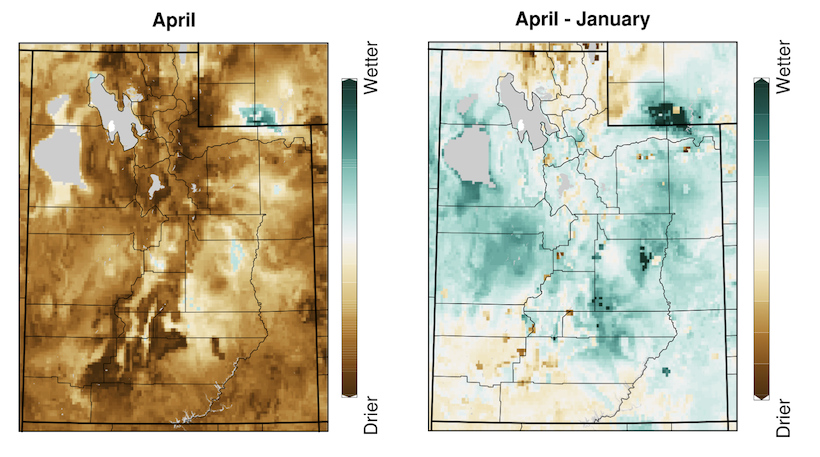
- Utah is still mostly under severe drought category in April, but compared to January, central and eastern Utah have seen a tendency towards less severity.
- The most drought-intense regions are distributed along the slopes of the Wasatch Range, where orchid farms are most impacted by the dryness.
- Agricultural impacts are still extreme for central and eastern Utah, with farming reports of water allotments of 1% of a normal year’s allowance in some extreme cases. We do not expect a positive growing season for a great deal of the state's agricultural community.
- Ongoing drought could lead to water-use restrictions soon. Utah’s water supplies remain severely depleted heading into summer.
April Drought Conditions for Utah
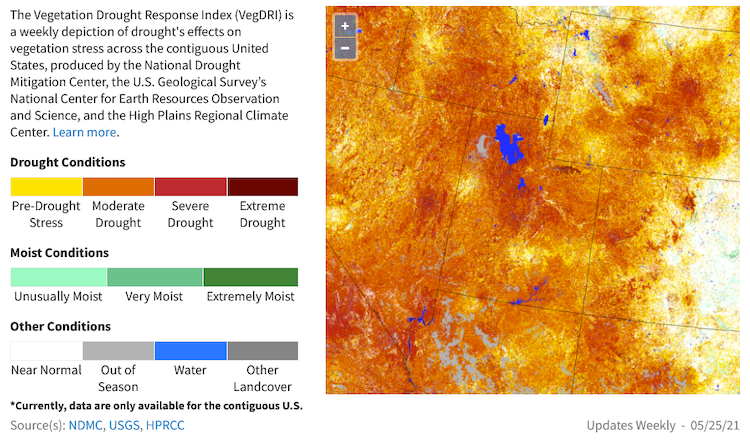
Vegetation Drought Response Index (VegDRI)
Utah Depth Averaged Soil Saturation
Wyoming
- May saw an improvement in a large area of central Wyoming going from D2 to D0 conditions as well as the removal of over a third of the Extreme Drought.
- The percentage of the state not in D0-D4 doubled in May and now is over 10 percent.
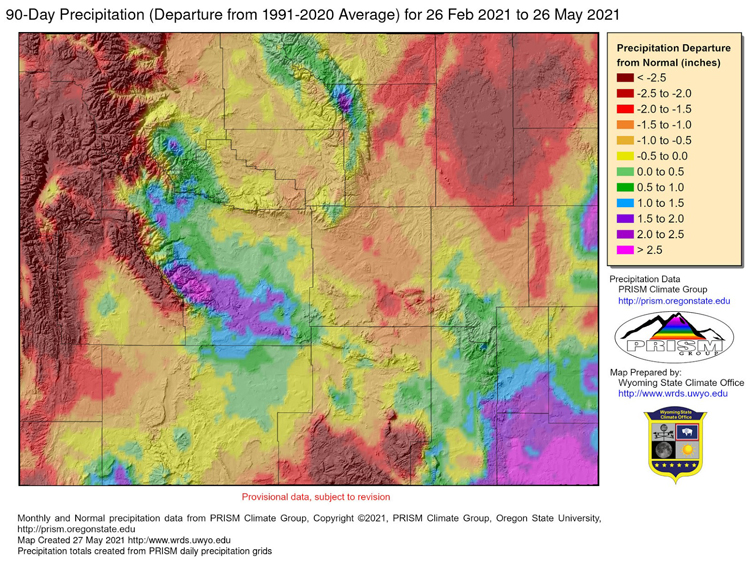
- Recent precipitation in the west has helped conditions there but still dry longer term with deficits greater than 2.5” showing up starting at 60 days.
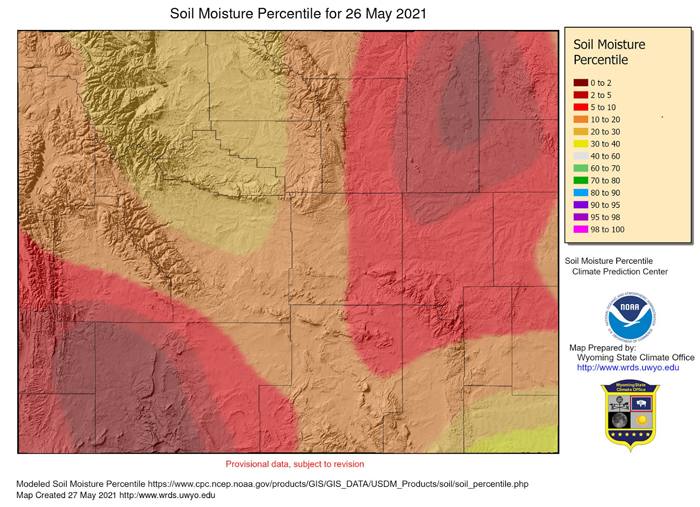
- Temperatures have generally been within +/-3F of average for May.Although there has been recent improvements, soil moisture continues to be a concern with significant areas being at the 5th percentile or less.
90-Precipitation Anomalies for Wyoming
Wyoming Soil Moisture Percentile
For More Information
More local information is available from the following resources:
In Case You Missed It
- Webinar Recap: Drought Update and Wildfire Outlook Webinar for California and the Southwest, May 24, 2021
Upcoming Events
- June 8, 2021, 10:00–10:45 a.m. MDT: Intermountain West DEWS Climate, Water, and Drought Assessment Webinar
- June 18, 2021, 11:00–11:30 a.m. MDT: Southwest Drought Briefing
Prepared By
Joel Lisonbee
NOAA/National Integrated Drought Information System (NIDIS)
Erin Saffell
Arizona State Climatologist/Arizona State University
Erin Boyle
Service Hydrologist, National Weather Service, Tucson, Arizona
Peter Goble
Colorado Climate Center/Colorado State University
Simon Wang and Jon Meyer
Utah Climate Center/Utah State University
Dave DuBois
New Mexico Climate Center/New Mexico State University
Tony Bergantino
Water Resources Data System, Wyoming State Climate Office
This drought early warning update is issued in partnership between the National Oceanic and Atmospheric Administration (NOAA), and the offices of the state climatologist for Arizona, Colorado, New Mexico, Utah, and Wyoming. The purpose of the update is to communicate a potential area of concern for drought expansion and/or development within the Intermountain West based on recent conditions and the upcoming forecast. NIDIS and its partners will issue future drought updates as conditions evolve.